
Fig. 3
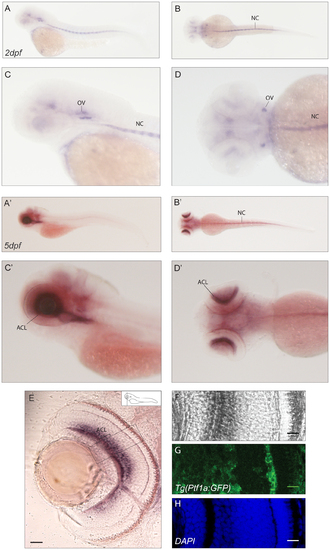
Expression pattern of cabp1b. (A–D2) Expression in 2dpf (A–D) and 5dpf (A2–D2) zebrafish embryos: lateral (A,C–A2,C2) and dorsal (B,D–B2,D2) views. At 2dpf a signal in the otic vesicles and the notochord can be detected. At 5dpf expression in the notochord and the amacrine cell layer of the retina is seen. (E–H). Cross-sections of retinae in the Tg(Ptf1a:GFP) transgenic line show staining of cabp1b in the amacrine cell layer.(E) Epifluorescence picture of a sectioned retina. Scale bar: 50 µm (F–H) Confocal images of the area selected in E. (F) In situ signal in bright field, (G) GFP signal restricted to amacrine cells, (H) DAPI nuclear stain. Scale bar: 20 µm. OV: otic vesicle, NC: notochord, ACL: amacrine cell layer. |
| Genes: | |
|---|---|
| Fish: | |
| Anatomical Terms: | |
| Stage Range: | Long-pec to Day 5 |