
Fig. 7
- ID
- ZDB-FIG-130210-10
- Publication
- Yin et al., 2012 - Inhibition of the pim1 oncogene results in diminished visual function
- Other Figures
- All Figure Page
- Back to All Figure Page
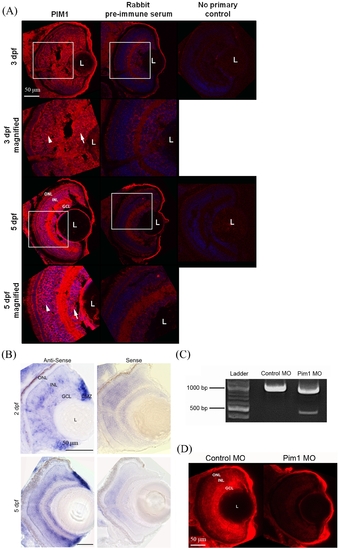
Localisation of Pim1 in the larval eye. (A) Immunohistochemical analysis of Pim1 protein (red) and DAPI (blue) in 3 and 5 dpf larval eyes reveals Pim1 expression throughout the neuoretina including the ganglion cell layer (arrow) and inner nuclear layer (arrowhead) at both timepoints. (B) Pim1 RNA is expressed in the INL, GCL and CMZ of 2 and 5 dpf larvae. (C) RT-PCR amplification of pim1 from 5 dpf cDNA results in a 1059 bp band in control morpholino-injected larvae and a second ~500 bp band in pim1 splice site morpholino-injected larvae consistent with knockdown of pim1.(D) Pim1 expression is present in the ONL, INL and GCL of 5 dpf larvae injected with 0.025 mM standard control morpholino but highly reduced in 5 dpf larvae injected with 0.025 mM pim1 morpholino. White boxes indicate the areas magnified. MO, morpholino; ONL, outer nuclear layer; INL, inner nuclear layer; GCL, ganglion cell layer; CMZ, ciliary marginal zone; L, lens. |
| Gene: | |
|---|---|
| Antibody: | |
| Fish: | |
| Knockdown Reagents: | |
| Anatomical Terms: | |
| Stage Range: | Long-pec to Day 5 |