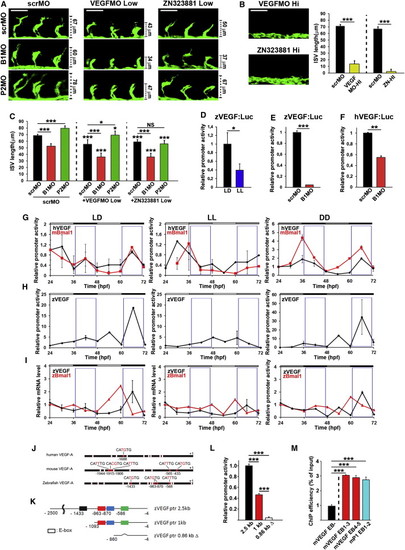
Circadian Clock Regulates Expression Levels of VEGF(A) Zebrafish embryos were injected with scrambled (scrMO) morpholino (A) or a low dose of the vegf morpholino (VEGFMO, 0.06 pmol/embryo) alone or in combinations with bmal1 (B1MO) or period2 (P2MO) morpholinos (0.2 pmol/embryo). Some embryos were treated with either DMSO vehicle or a low dose of VEGFR TKI (0.3 μM ZN323881) alone or in combinations with bmal1, period2, or scrambled morpholinos (0.2 pmol/embryo). The embryos were subsequently raised under the LD condition.(B) High doses of the vegf morpholino (0.2 pmol/embryo) or ZN323881 (1.0 μM) were also delivered to zebrafish embryos. Dashed lines in (A and B) indicate the maximal length of ISVs in various groups. Bars = 50 μm. Quantification of the average ISV length ± SEM in 24 hpf embryos (n = 12–68 embryos/group).(C) Quantification of the average ISV length ± SEM in 24 hpf embryos from the experiment shown in (A) (average n = 36 embryos/group).(D) Zebrafish vegf promoter activity as measured by average luciferase activity ± SEM in zebrafish embryos exposed to LD or LL (n = 20 embryos/group).(E) Zebrafish vegf promoter activity in scrambled or bmal1 morpholino-treated zebrafish embryos as measured by average luciferase activity ± SEM (n = 20 embryos/group).(F) Human vegf promoter activity in scrambled or bmal1 morpholino-treated zebrafish embryos as measured by average luciferase activity ± SEM (n = 20 embryos/group).(G–H) Values of average relative luciferase activity ± SEM in embryos exposed to LD, LL, or DD. Black line: Luciferase activity in zebrafish embryos injected with human vegf promoter-luciferase (G) or zebrafish vegf promoter-luciferase (H). Red lines in G represent luciferase activity in zebrafish embryos injected with a mouse bmal1 promoter-luciferase reporter plasmid.(I) qPCR analysis of average ± SEM endogenous levels of bmal1 (red line) and vegf (black line) under LD, LL, and DD conditions.(J) Sequence analysis of human, mouse, and zebrafish vegf promoter regions that contain E-boxes that bind to Bmal1. Red boxes represent the known Bmal1 binding E-boxes, and white boxes represent unknown binding E-boxes.(K) Schematic diagram showing various deleted mutants of the zebrafish vegf promoter region. ptr, promoter.(L) Average luciferase activity ± SEM in embryos injected with various deleted mutants of the zebrafish vegf promoter-luciferase and subsequently raised under LD exposure (n = 20 embryos/group).(M) ChIP assay of average Bmal1 binding ± SEM to the zebrafish vegf promoter. EB, E-box. p < 0.05; p < 0.01; and p < 0.001. NS, not significant.See also Figures S3 and S4.
|
