
Fig. 5
- ID
- ZDB-FIG-120725-20
- Publication
- Zhou et al., 2012 - Comparative and Evolutionary Analysis of the HES/HEY Gene Family Reveal Exon/Intron Loss and Teleost Specific Duplication Events
- Other Figures
- All Figure Page
- Back to All Figure Page
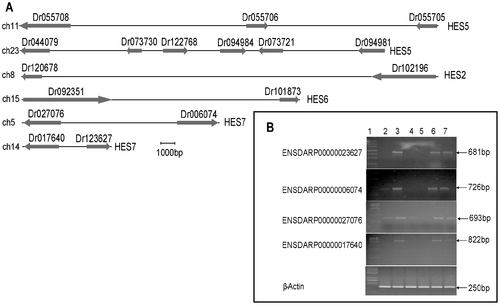
Zebrafish HES/HEY gene loci and expression pattern. (A) The gene loci of the zebrafish HES2, HES6, HES5 and HES7 genes. The arrows towards the right referred the gene on the positive-strand (+). The arrows towards the left referred the gene on the negative-strand (−). We cut short the Ensembl protein ID to reserve the last six digits in this diagram. For example, ENSDARP00000123627 is truncated as Dr123627. (B) Expression of HES7 genes in zebrafish. Transcripts of ENSDARP00000023627, ENSDARP00000006074, ENSDARP00000027076, ENSDARP00000017640 and β-actin were detected by RT-PCR. Lane 1 showed the molecular weight marker of 100 bp ladder. Gene expression patterns were obtained using total RNAs extracted from eye (lane 2), gill (lane 3), female ovary (lane 4), male testis (lanes 5), heart (lanes 6), and liver (lane 7). β-actin was performed to assess quantitative variations in mRNAs among all the samples. |
| Genes: | |
|---|---|
| Fish: | |
| Anatomical Terms: | |
| Stage: | Adult |