|
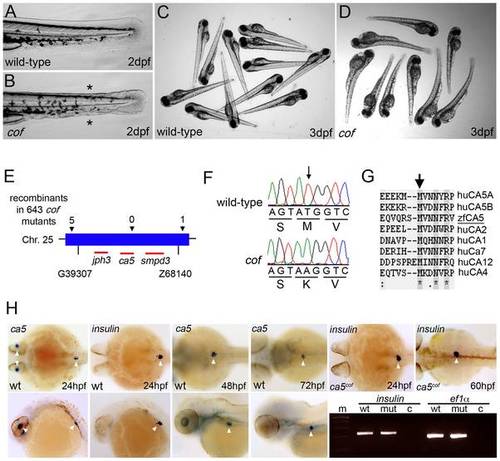
Characterization, mapping and cloning of the cof mutant. (A–D) Phenotypical comparison of wild-type and cof mutant embryos at 2 dpf (A, B) and 3 dpf (C, D). Asterisks mark the collapse of the medial fins in the cof mutant. (E) Summary of the linkage analysis and mapping of the cof locus at chromosome 25. The arrows mark the direction of the mutation. Red lines indicate the various transcripts in the genomic region. (F) Sequence chromatograms of wild-type and cof mutant cDNA. The corresponding amino acid residues are indicated below. (G) CA5 protein sequence alignment of zebrafish and human and other members of the human CA protein family. Arrow marks residue M280 that is substituted to a lysine in cof mutant embryos. (H) Detection of ca5 mRNA in wild-type embryos at 24, 48 and 72 hpf by in situ hybridization. mRNA expression of insulin at 24 hpf marks the position of pancreatic β-cells. Upper panel shows dorsal view and lower panels lateral view. White arrowheads mark the expression in the lens and the pancreatic β-cells.
|