
Fig. 4
- ID
- ZDB-FIG-120405-54
- Publication
- Eames et al., 2012 - Evolution of the osteoblast: Skeletogenesis in gar and zebrafish
- Other Figures
- All Figure Page
- Back to All Figure Page
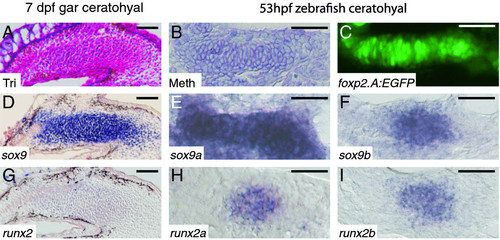
Chondrogenic condensations of gar and zebrafish display similar transcription factor expression patterns. A, Trichrome-stained coronal gar section. B, Methylene blue-stained coronal zebrafish section. C, confocal slice of foxp2.A:EGFP zebrafish, which express GFP in developing chondrocytes [45]. D-I, in situ hybridization on coronal sections. Trichrome staining of the 7 dpf gar ceratohyal (A) and Methylene blue staining of the 53 hpf zebrafish ceratohyal (B) show mesenchymal condensation. Confocal imaging of foxp2.A:EGFP transgenic zebrafish ceratohyal (C) illustrates condensation of chondrogenic cells at 53 hpf. Similar to expression of sox9 in the gar ceratohyal (D), zebrafish ceratohyal expressed both sox9a (E) and sox9b (F) co-orthologs. While transcripts for runx2 were slightly above background in the 7 dpf gar ceratohyal (G), both runx2a (H) and runx2b (I) co-orthologs were expressed highly in 53 hpf zebrafish ceratohyal. Scale bars: A-I = 30 µm. Abbreviations: dpf = days post-fertilization; hpf = hours post-fertilization; Meth = Methylene blue; Tri = Trichrome. |
| Genes: | |
|---|---|
| Fish: | |
| Anatomical Terms: | |
| Stage: | Long-pec |