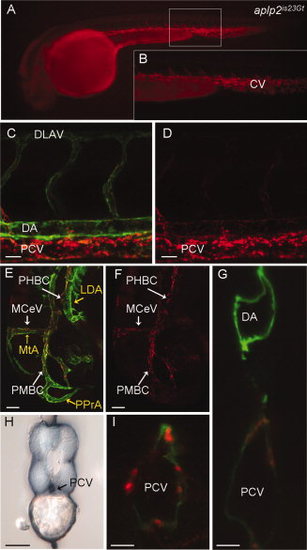
Red fluorescent protein (RFP) expression in the aplp2is23Gt gene trap line. Fluorescence images of live aplp2is23Gt; Tg(flk1:moesin-gfp)is1 embryos. A: Aplp2-RFP fluorescence in the caudal vein and intersegmental vessels in a 34 hours post fertilization (hpf) embryo. B: Enlargement of boxed area in (A). C–F: RFP fluorescence at 32 hpf was observed in the trunk (C,D) and the head (E,F). C,E: Aplp2-RFP fluorescence overlaps with green fluorescent protein (GFP) expression in endothelial cells in the veins, but not the arterial vessels (MTA, PPrA, LDA marked with yellow arrows in E). Weak expression is detected in the dorsal aorta. H: Immunolocalization with anti-RFP antibody shows Appa-RFP was in the caudal vein but absent from the dorsal aorta. G,I: Confocal images of cross-sections through the trunk of 36 hpf embryo shows Aplp2-RFP accumulation at the posterior caudal vein. CV, caudal vein; LDA, lateral dorsal aorta; MCeV, midcerebral vein; MtA, metencephalic artery; PHBC, primordial hindbrain channel; PMBC, primordial midbrain channel; PPrA, primitive prosencephalic artery. Scale bars = 20 μm in C,D, 50 μm in E–I.
|
