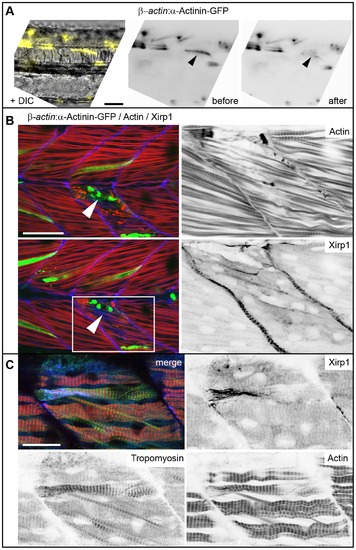
Fig. 5
|
Clonal analysis of laser-induced myocellular injuries. (A–B) Laser-injury and recovery within the same embryo. (A) Left: DIC image superimposed with image of individual muscle cells marked by Tg[βactin:α-actinin-gfp] expression (false colored in yellow). Right: laser-injury was performed by targeting one of the α-Actinin-GFP positive muscle cells. Immediately upon laser-injury, α-Actinin-GFP expression within the damaged cell is diminished (arrowheads). Scale bar: 50 μm. (B) Confocal images of two z-scan planes of an immunohistochemical staining show strong Xirp1 expression within 2.5 hours after laser injury in muscle cells directly adjacent to the targeted cell that was most severely affected by the laser-injury (arrowheads). Pictures on the right are details from the insert (white box on the bottom left picture). Green: βactin:α-Actinin-GFP; red: Actin; blue: Xirp1. Scale bar: 50 μm. (C) Confocal z-scan projection of an immunohistochemical staining 5 hours after laser-induced injury reveals that strong Xirp1 expression correlates with a pattern of Tropomyosin distribution that is different from unaffected regions of the somite. Green: Tropomyosin; red: Actin; blue: Xirp1. Scale bar: 20 μm. |

