
FIGURE
Fig. 4
Fig. 4
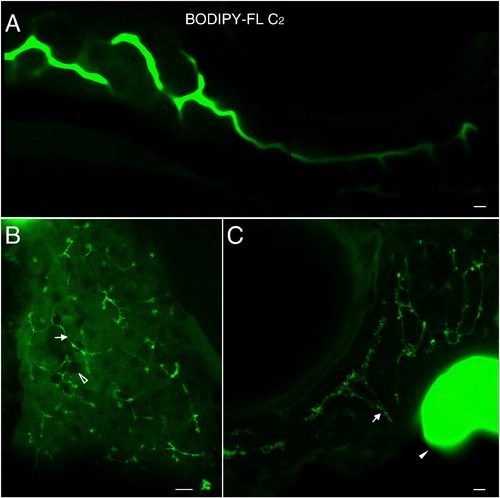
BODIPY-FL C2 does not participate appreciably in lipid metabolism. A. Unlike the longer chain length analogs, BODIPY-FL C2 fluorescence appears primarily in the intestinal lumen of larvae. B. In the liver BODIPY-FL C2 accumulates in the hepatic ducts (arrow) and diffusely in hepatocytes, whose nuclei are discernable (empty arrowhead). C. The ductal network of the exocrine pancreas is also labeled (arrow). The gall bladder (filled arrowhead) is indicated in C. A. is a composite of 2 separate confocal images. Scale bars = 10μm. (n = 3; 6 larvae per feed). |
Expression Data
Expression Detail
Antibody Labeling
Phenotype Data
Phenotype Detail
Acknowledgments
This image is the copyrighted work of the attributed author or publisher, and
ZFIN has permission only to display this image to its users.
Additional permissions should be obtained from the applicable author or publisher of the image.
Reprinted from Developmental Biology, 360(2), Carten, J.D., Bradford, M.K., and Farber, S., Visualizing digestive organ morphology and function using differential fatty acid metabolism in live zebrafish, 276-85, Copyright (2011) with permission from Elsevier. Full text @ Dev. Biol.