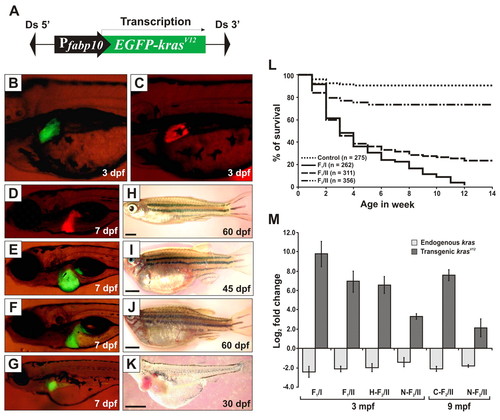
Generation and characterization of Tg(fabp10:EGFP-krasV12) transgenic zebrafish. (A) Schematic diagram of the DNA construct used to generate Tg(fabp10:EGFP-krasV12) transgenic zebrafish. Ds, maize Ds transposon sequence. (B–G) Liver-specific expression of EGFP-KrasV12 in F1 transgenic fry (B,E,F,G) as compared with the Tg(fabp10:dsRFP; elaA:EGFP) transgenic line expressing RFP in liver (Korzh et al., 2008) as normal control (C,D). (H–K) Gross observation of control fish (H) and F1 krasV12 transgenic fish (I–K). Ages of the fish are indicated. Scale bars: 2 mm. (L) Kaplan-Meier survival curves of the Tg(fabp10:EGFP-krasV12) fish for three groups of heterozygous transgenic zebrafish from F1/I (n=262), F1/II (n=311), F2/II (n=356) and WT siblings as control (n=275). (M) Determination of endogenous and transgenic kras expression levels by qRT-PCR. Log2 fold changes for endogenous and transgenic kras mRNAs were calculated against an internal housekeeping gene (β-actin) using the CT method. Histological analysis was performed to confirm their neoplastic stages before qRT-PCR (H, hyperplasia; C, carcinoma; N, normal liver). Results are presented as the mean ± s.d. and each bar represents five biological replicates.
|
