
Fig. 2
- ID
- ZDB-FIG-110928-27
- Publication
- Culbertson et al., 2011 - Chondrogenic and Gliogenic Subpopulations of Neural Crest Play Distinct Roles during the Assembly of Epibranchial Ganglia
- Other Figures
- All Figure Page
- Back to All Figure Page
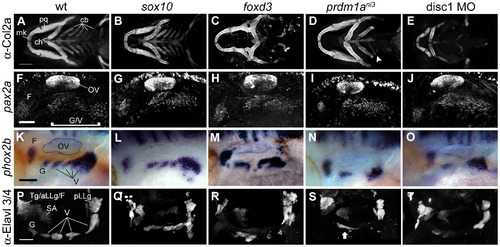
Disruptions in neural crest cause late defects in epibranchial ganglion morphology without affecting placode specification. (A–E) Ventral view of head skeleton visualized with anti-Collagen2a antibody at 4 dpf. (A) The following structures are visible in wildtype: Meckel′s cartilage, palatoquadrate, ceratohyal and ceratobranchial arches. Sox10 mutant (B) exhibits normal morphology. Radical disruption of structure is apparent in foxd3 mutants (C) and disc1 morphants (E). prdm1a mutant (D) displays grossly normal anterior jaw structures and deficits in the posterior arches; in this example, an unpaired ceratobranchial vestige can be seen (arrowhead). (F–J) Anti-Pax2 immunofluorescence at 24 hpf. Wildtype (F) shows facial placode and unsegmented glossopharyngeal/vagal placode field (K–O) phox2b expression at 48 hpf. Wildtype (K) displays normal segregation of facial,glossopharyngeal, and vagal ganglia. Defects are apparent in foxd3 (M) and prdm1a (N) mutants and disc1 morphant (O). sox10 mutant (K) display morphology and segmentation comparable to wildtype siblings (F). P–T: Ganglion morphology visualized by anti-Elavl3/4 antibody staining at 4 dpf. (K) Wildtype control shows glossopharyngeal and vagal ganglia. Posterior lateral line, statoacoustic and the fused trigeminal, anterior lateral line and facial ganglia can also be seen. Defects are apparent in sox10 (Q), foxd3 (R), prdm1a (S) mutants and disc1 morphant (T). Arrow in (S) shows an example of fusion often seen in prdm1a mutants. Abbreviations: mk = Meckel′s cartilage; pq = palatoquadrate; ch = ceratohyal; cb = ceratobranchial arches; OV = otic vesicle; F = facial ganglion; Tg/aLL/F = trigeminal/anterior lateral line/facial ganglion complex; SA = statoacoustic ganglion; pLLg = posterior lateral line ganglion; G = glossopharyngeal ganglion; V = vagal ganglia. Scale bar in (A) = 100 μm. Scale bars in (F), (K) and (P) = 50 μm. |
| Gene: | |
|---|---|
| Antibodies: | |
| Fish: | |
| Knockdown Reagent: | |
| Anatomical Terms: |
|
| Stage Range: | Prim-5 to Day 4 |
| Fish: | |
|---|---|
| Knockdown Reagent: | |
| Observed In: | |
| Stage Range: | Long-pec to Day 4 |