
FIGURE
Fig. 3
- ID
- ZDB-FIG-110718-1
- Publication
- Fortunato et al., 2011 - Identification and expression of soul/p22HBP genes in zebrafish
- Other Figures
- All Figure Page
- Back to All Figure Page
Fig. 3
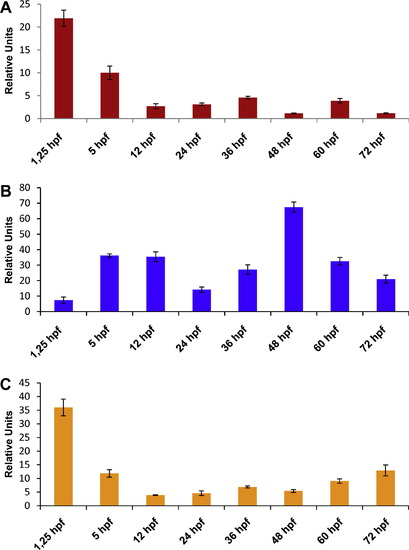
Temporal expression of zebrafish soul genes. qPCR was performed with cDNA obtained from wild type embryos at 1.25, 5, 12, 24, 36, 48, 60 and 72 hpf. soul1, soul2 and soul4 relative levels of expression depicted in (A-C), respectively. Expression levels were normalized against rpl13a and elfa1 reference genes, as described in Section 2. Black bars represent the standard deviation. |
Expression Data
| Genes: | |
|---|---|
| Fish: | |
| Anatomical Term: | |
| Stage Range: | 8-cell to Protruding-mouth |
Expression Detail
Antibody Labeling
Phenotype Data
Phenotype Detail
Acknowledgments
This image is the copyrighted work of the attributed author or publisher, and
ZFIN has permission only to display this image to its users.
Additional permissions should be obtained from the applicable author or publisher of the image.
Reprinted from Gene expression patterns : GEP, 11(5-6), Fortunato, A.E., Langellotto, F., and Sordino, P., Identification and expression of soul/p22HBP genes in zebrafish, 360-369, Copyright (2011) with permission from Elsevier. Full text @ Gene Expr. Patterns