
Fig. 4
- ID
- ZDB-FIG-110608-28
- Publication
- Knopf et al., 2011 - Bone Regenerates via Dedifferentiation of Osteoblasts in the Zebrafish Fin
- Other Figures
- All Figure Page
- Back to All Figure Page
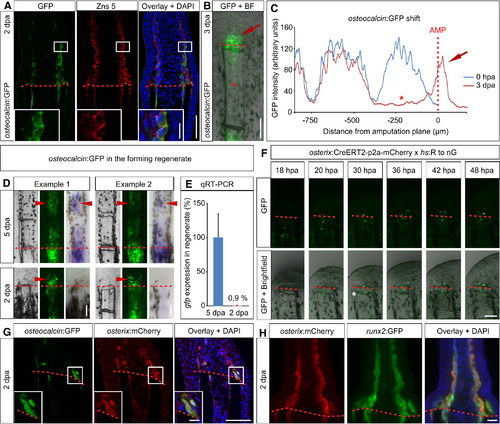
Dedifferentiated Osteoblasts Form Part of the Blastema Where They Redifferentiate (A) osteocalcin:GFP+ Zns 5+ cells accumulate in the lateral parts of the 2 dpa blastema. Inset shows magnification of the boxed area (n = 3 fish, 18/28 sections). Scale bars, 50 μm (overview) and 10 μm (inset). (B) Live regenerating fin of an osteocalcin:GFP fish at 3 dpa. GFP+ cells are present in the blastema (red arrow). Please note that the GFP signal has nearly vanished from the distal-most stump segment (asterisk) (n = 5 fish, 33/42 rays). Scale bar, 100 μm. (C) Intensity measurement of a representative osteocalcin:GFP fish fin ray at 0 hpa and 3 dpa. Downregulation of the GFP signal in the 3 dpa stump is indicated by the asterisk; the appearance of the signal in the blastema is indicated by the red arrow. (D) GFP fluorescence in the blastema of osteocalcin:GFP fish at 2 dpa is due to persistence of GFP. In 5 dpa fins GFP fluorescence is detectable in the mineralizing bone segments of the regenerate, and the same regions express gfp mRNA as detected by whole-mount in situ hybridization (arrowheads) (n = 8 fish, 128/137 fin rays). In the 2 dpa blastema, GFP, but not gfp mRNA, can be detected (arrowheads) (n = 9 fish, 168/168 fin rays). Scale bars, 100 μm. (E) Expression level +SD of gfp mRNA in the 2 dpa blastema relative to the level detected at 5 dpa, as determined by qRT-PCR (n = 11 fish each). (F) GFP-labeled stump osteoblasts in osterix:CreERT2-p2a-mCherry; hs:R to nG double-transgenic fish treated with 4-HT migrate into the forming blastema and cross a segment boundary (white asterisk). Scale bar, 100 µm. See also Figure 5A. (G) In the 2 dpa blastema of osteocalcin:GFP; osterix:mCherry double-transgenic fish, GFP+ cells express mCherry at the same time, indicating redifferentiation of stump-derived osteoblasts along the bone lineage. Inset shows magnification of boxed area (n = 4 fish, 60/82 sections). Scale bars, 50 μm (overview) and 5 µm (inset). (H) osterix:mCherry+ cells express runx2:GFP in the 2 dpa blastema (n = 4 fish, 20/20 sections). Scale bar, 20 μm. See also Figure S3. |
| Genes: | |
|---|---|
| Antibody: | |
| Fish: | |
| Condition: | |
| Anatomical Terms: | |
| Stage: | Adult |
Reprinted from Developmental Cell, 20(5), Knopf, F., Hammond, C., Chekuru, A., Kurth, T., Hans, S., Weber, C.W., Mahatma, G., Fisher, S., Brand, M., Schulte-Merker, S., and Weidinger, G., Bone Regenerates via Dedifferentiation of Osteoblasts in the Zebrafish Fin, 713-724, Copyright (2011) with permission from Elsevier. Full text @ Dev. Cell