
Fig. 4
- ID
- ZDB-IMAGE-110608-28
- Genes
- Antibodies
- Publication
- Knopf et al., 2011 - Bone Regenerates via Dedifferentiation of Osteoblasts in the Zebrafish Fin
- All Figures
- Figures for Knopf et al., 2011
|
Fig. 4
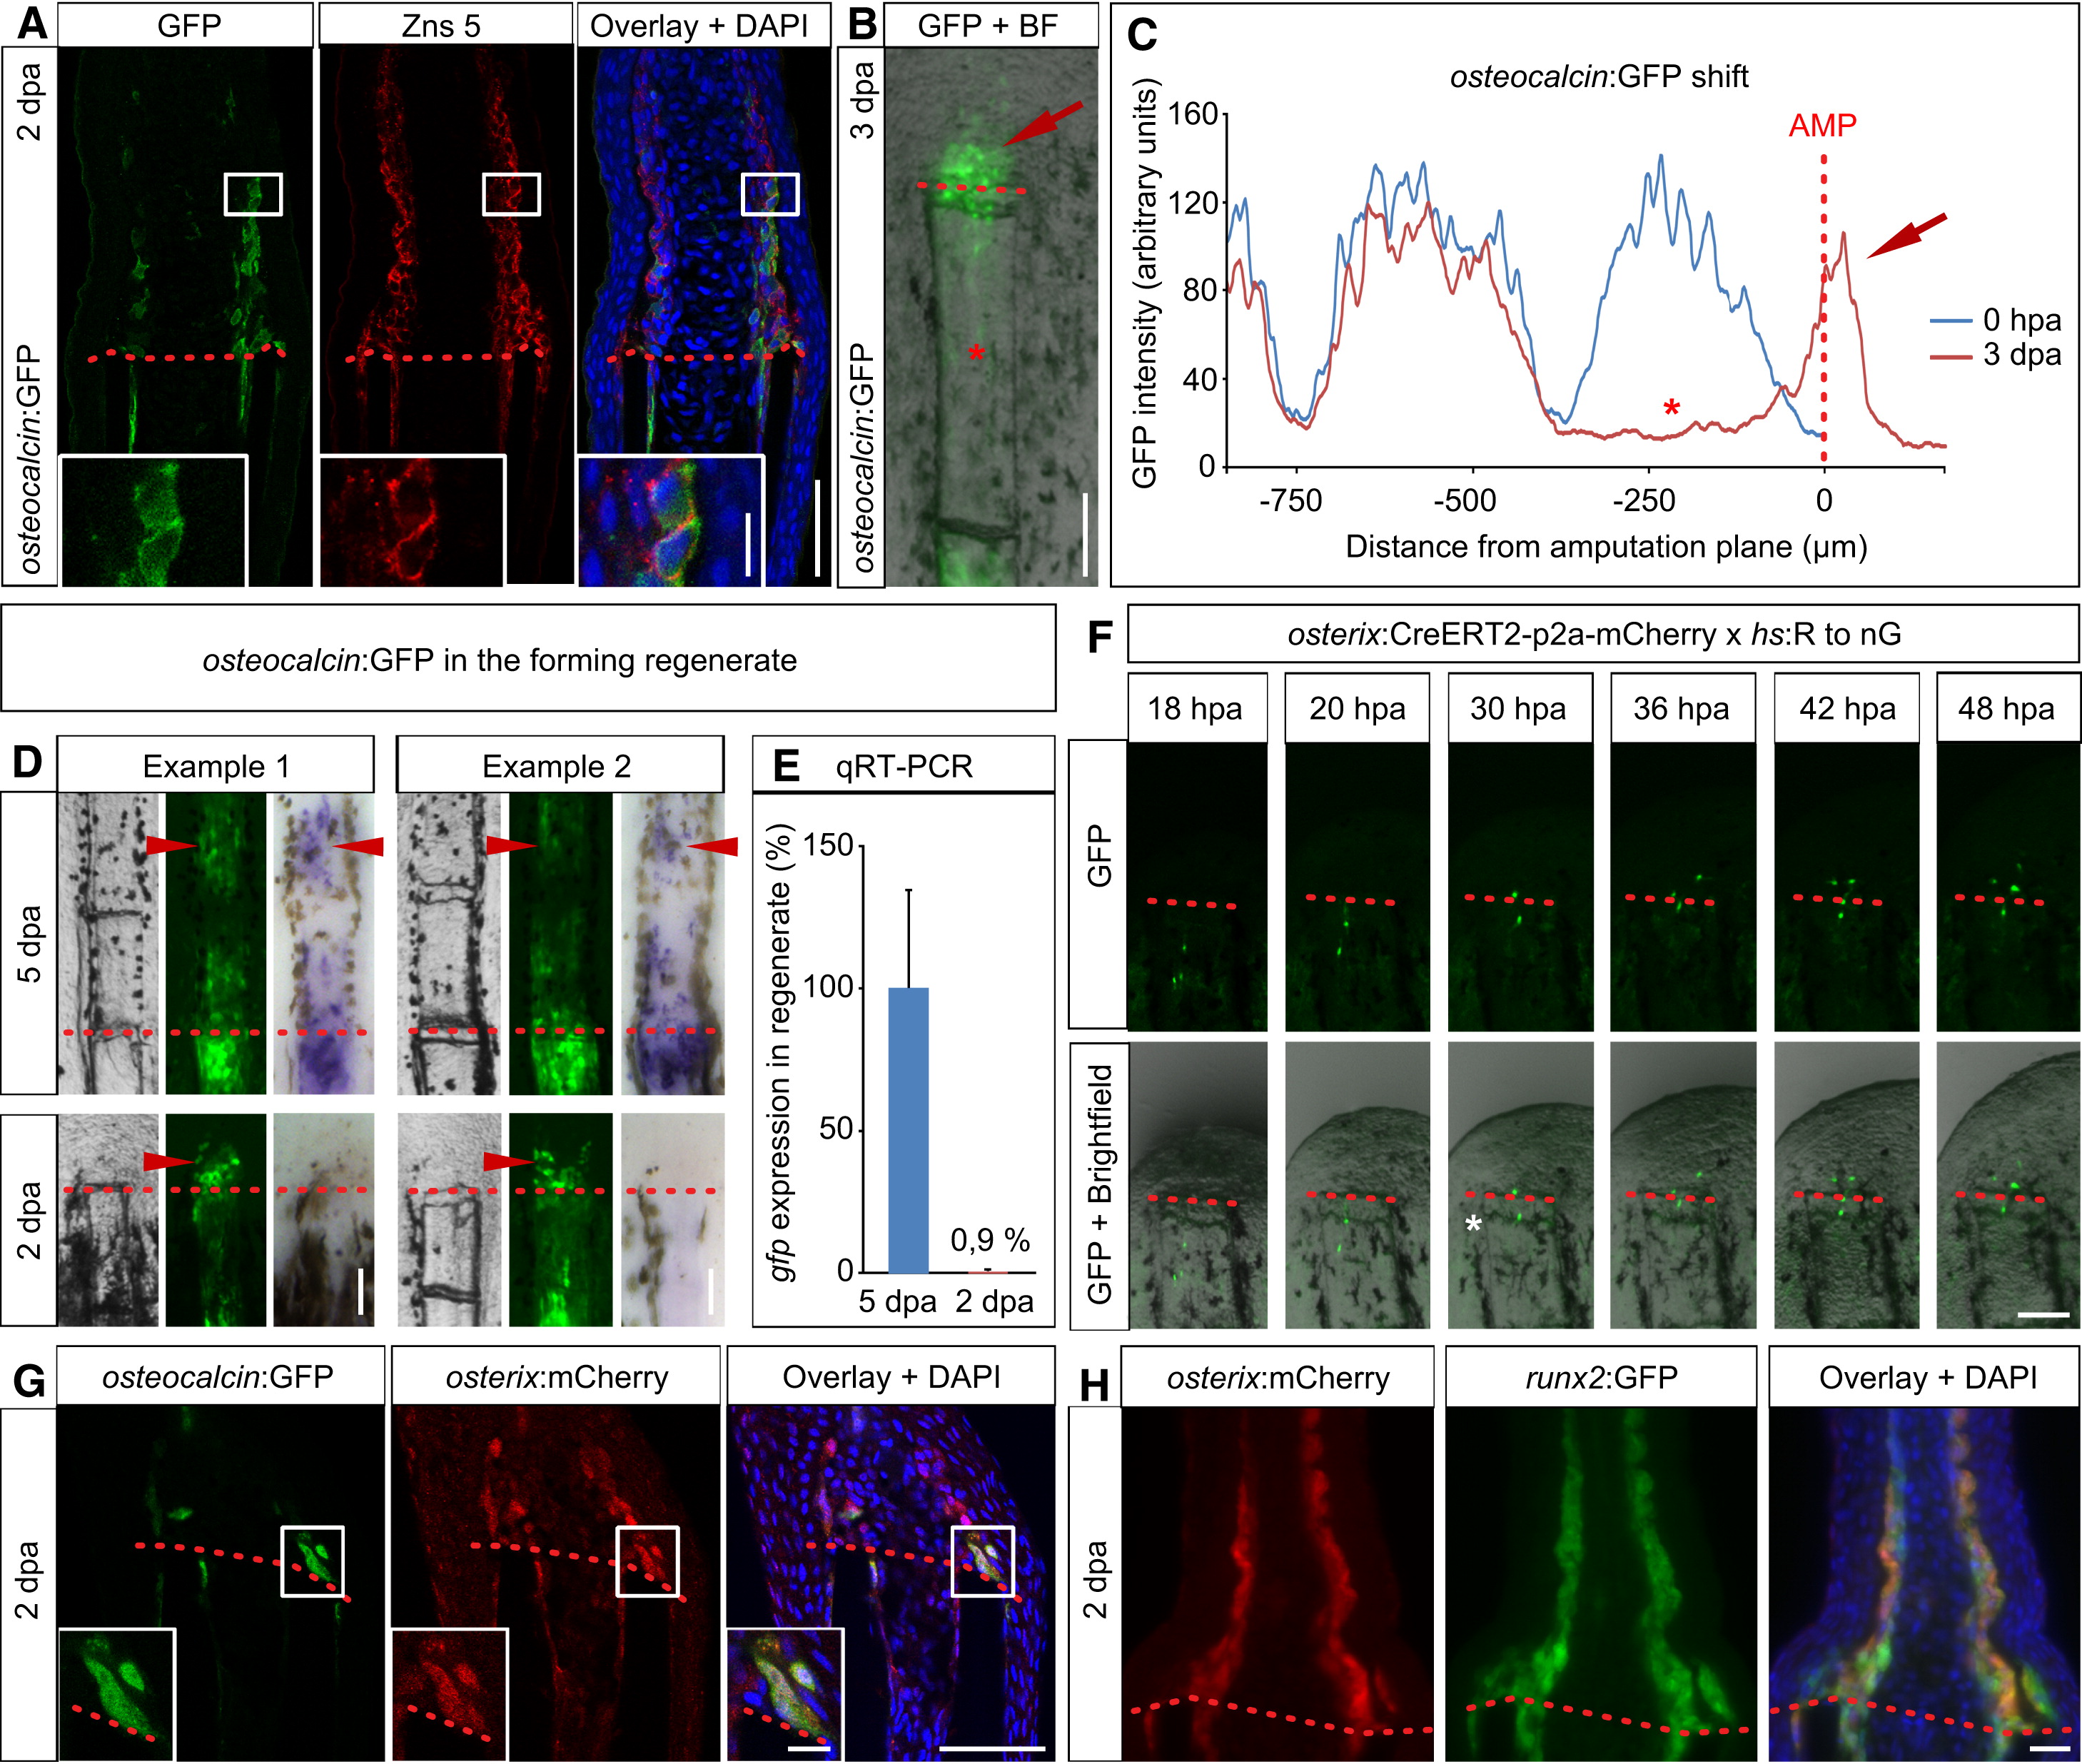
Dedifferentiated Osteoblasts Form Part of the Blastema Where They Redifferentiate
(A) osteocalcin:GFP+ Zns 5+ cells accumulate in the lateral parts of the 2 dpa blastema. Inset shows magnification of the boxed area (n = 3 fish, 18/28 sections). Scale bars, 50 μm (overview) and 10 μm (inset).
(B) Live regenerating fin of an osteocalcin:GFP fish at 3 dpa. GFP+ cells are present in the blastema (red arrow). Please note that the GFP signal has nearly vanished from the distal-most stump segment (asterisk) (n = 5 fish, 33/42 rays). Scale bar, 100 μm.
(C) Intensity measurement of a representative osteocalcin:GFP fish fin ray at 0 hpa and 3 dpa. Downregulation of the GFP signal in the 3 dpa stump is indicated by the asterisk; the appearance of the signal in the blastema is indicated by the red arrow.
(D) GFP fluorescence in the blastema of osteocalcin:GFP fish at 2 dpa is due to persistence of GFP. In 5 dpa fins GFP fluorescence is detectable in the mineralizing bone segments of the regenerate, and the same regions express gfp mRNA as detected by whole-mount in situ hybridization (arrowheads) (n = 8 fish, 128/137 fin rays). In the 2 dpa blastema, GFP, but not gfp mRNA, can be detected (arrowheads) (n = 9 fish, 168/168 fin rays). Scale bars, 100 μm.
(E) Expression level +SD of gfp mRNA in the 2 dpa blastema relative to the level detected at 5 dpa, as determined by qRT-PCR (n = 11 fish each).
(F) GFP-labeled stump osteoblasts in osterix:CreERT2-p2a-mCherry; hs:R to nG double-transgenic fish treated with 4-HT migrate into the forming blastema and cross a segment boundary (white asterisk). Scale bar, 100 µm. See also Figure 5A.
(G) In the 2 dpa blastema of osteocalcin:GFP; osterix:mCherry double-transgenic fish, GFP+ cells express mCherry at the same time, indicating redifferentiation of stump-derived osteoblasts along the bone lineage. Inset shows magnification of boxed area (n = 4 fish, 60/82 sections). Scale bars, 50 μm (overview) and 5 µm (inset).
(H) osterix:mCherry+ cells express runx2:GFP in the 2 dpa blastema (n = 4 fish, 20/20 sections). Scale bar, 20 μm. See also Figure S3.
Reprinted from Developmental Cell, 20(5), Knopf, F., Hammond, C., Chekuru, A., Kurth, T., Hans, S., Weber, C.W., Mahatma, G., Fisher, S., Brand, M., Schulte-Merker, S., and Weidinger, G., Bone Regenerates via Dedifferentiation of Osteoblasts in the Zebrafish Fin, 713-724, Copyright (2011) with permission from Elsevier. Full text @ Dev. Cell