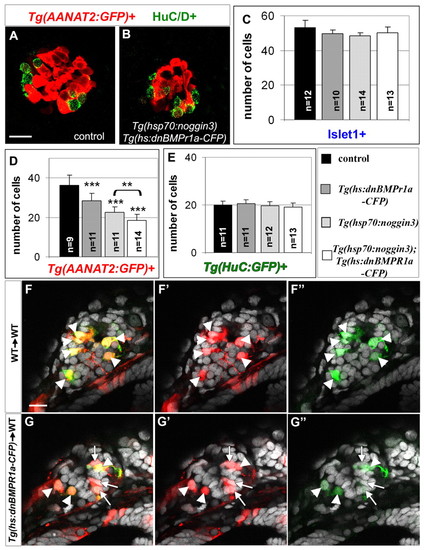
BMP activity is necessary for PhRs specification. (A,B) Confocal sections of control (A) and Tg(hs:dnBmpr1a-CFP);Tg(hsp70:noggin3) double transgenic (B) embryo. Pineal glands are double labeled with the Tg(AANAT2:GFP) transgene (in red) and a HuC/D antibody (in green) at 48 hours. Anterior is upwards. Scale bar: 16 μm. (C-E) Average numbers of Isl1+ neurons, Tg(AANAT2:GFP)+ and Tg(HuC:GFP)+ cells per pineal gland in control, Tg(hs:dnBmpr1a-CFP) transgenic, Tg(hsp70:noggin3) transgenic and Tg(hs:dnBmpr1a-CFP);Tg(hsp70:noggin3) double-transgenic embryos at 48 hours. Error bars represent s.d. **P<0.001; ***P<0.0005 using a t-test. The number (n) of embryos analyzed is noted for each case. (F-G′′) Confocal images of the pineal gland of wild-type host embryos that have received cells transplanted from wild type (F-F′′) or Tg(hs:dnBmpr1a-CFP) (G-G′′) donors. Tg(AANAT2:GFP)+ PhRs are in green and the transplanted cells are shown in red. White arrowheads show transplanted cells with a PhR identity; white arrows indicate transplanted cells not expressing GFP from the Tg(AANAT2:GFP) transgene.
|
