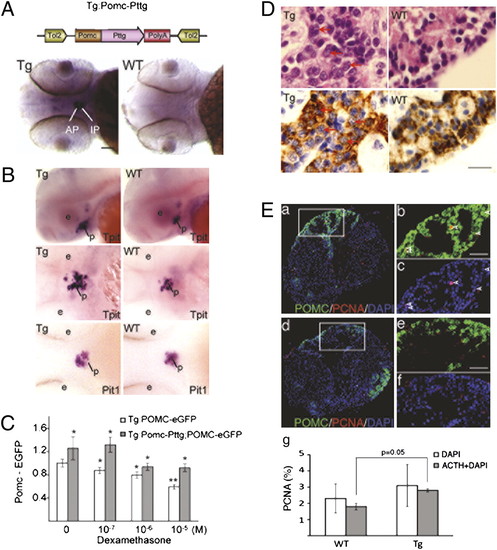
Pituitary pathology of zPttg transgenic zebrafish, Tg:Pomc-zPttg. (A) Top: Schematic representation of Pomc-zPttg transgene. Bottom: Pituitary expression of zPttg in Tg:Pomc-zPttg zebrafish at 72 hpf. F1 Tg:Pomc-zPttg transgenic zebrafish were crossed with WT zebrafish, resulting in F2 embryos with 50% of the progeny positive (Left, Tg), and 50% negative (Right, WT) for pituitary zPttg expression assessed by whole-mount in situ analysis (ventral view, with anterior aspect to the left). (B) Tg:Pomc-Pttg embryos showed increased Tpit/Tbx19 expression, whereas no significant change of Pit-1 expression by whole-mount in situ analysis at 48 hpf. Antisense mRNA probes are indicated at right lower corner of each panel. Top, Lateral view; Middle and Bottom, ventral view, anterior aspect to the left. (C) Tg:Pomc-Pttg; POMC-eGFP embryos exhibited increased pituitary eGFP signal, and are more resistant to Gc-negative feedback than Tg:Pomc-Pttg–negative siblings. Double transgenic embryos (Tg:Pomc-Pttg; POMC-eGFP) were generated by breeding Tg:Pomc-Pttg fish with an established transgenic line POMC-eGFP, wherein eGFP expression is driven by the same zPomc promoter. Fluorescence intensity of POMC-GFP–positive cells was measured in live embryos after dexamethasone treatment at 4 dpf. (D) Pituitary hematoxylin/eosin stain (Top) and ACTH immunohistochemistry (Bottom) of sections derived from WT and Tg:Pomc-Pttg transgenic fish (Tg) at 20 mo. Red arrows indicate neoplastic mitotic ACTH-expressing cells. (E) Tg:pomc-pttg pituitary exhibited increased number of PCNA and ACTH coexpressing cells. Representative confocal pituitary images of fluorescence immunohistochemistry detecting PCNA (red) and ACTH (green) expression in Tg:Pomc-Pttg (a–c) and WT (d–f) zebrafish. Paraffin slides were counterstained with DAPI (blue). Arrow-heads indicate ACTH-producing cells coexpressing intranuclear PCNA. PCNA index was calculated in WT and Tg:Pomc-Pttg pituitary (g) (mean ± SE, n = 500 cells counted per pituitary, two pituitaries per group; *P = 0.05). AP, anterior pituitary; IP, pars intermedia. P, pituitary. (Scale bar, 50 μm.)
|
