
Fig. 2
- ID
- ZDB-FIG-110318-49
- Publication
- Saito et al., 2010 - Inter-species transplantation and migration of primordial germ cells in cyprinid fish
- Other Figures
- All Figure Page
- Back to All Figure Page
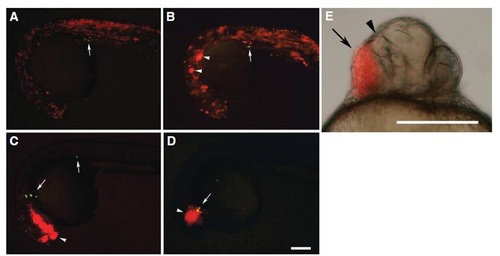
Distribution of transplanted somatic cells and PGCs in intra- and inter-specific chimeras at one day post fertilization. (A) Zebrafish-to-zebrafish BT chimera. Transplanted somatic cells (labeled red) are distributed equally throughout the embryonic body, while PGCs (labeled green) are located in the region where the gonad will develop. (B) Pearl danio-tozebrafish BT chimera. Some of the donor somatic cells have formed clumps in the host embryo, while the donor-derived PGCs are located in the gonadal region. (C) Goldfish-to-zebrafish BT chimera. The transplanted somatic cells have formed large aggregations and some of the PGCs are located in proximity to the somatic cells. (D) Loach-to-zebrafish BT chimera. The transplanted somatic cells are tightly aggregated around the embryonic head region and the PGCs are located close to the aggregation. (E) Loach-to-zebrafish BT chimera. In this chimera, the transplanted cells (arrow) localized around head region and disrupted development of optic structure of host embryo (arrowhead). Arrows in A-D indicate the donor-derived PGCs. Arrowheads in A-D indicate the donor cell aggregations. Scale bar indicates 500 μm. |