
- Title
-
Inter-species transplantation and migration of primordial germ cells in cyprinid fish
- Authors
- Saito, T., Goto-Kazeto, R., Fujimoto, T., Kawakami, Y., Arai, K., and Yamaha, E.
- Source
- Full text @ Int. J. Dev. Biol.
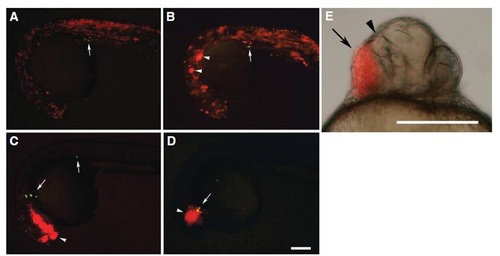
Distribution of transplanted somatic cells and PGCs in intra- and inter-specific chimeras at one day post fertilization. (A) Zebrafish-to-zebrafish BT chimera. Transplanted somatic cells (labeled red) are distributed equally throughout the embryonic body, while PGCs (labeled green) are located in the region where the gonad will develop. (B) Pearl danio-tozebrafish BT chimera. Some of the donor somatic cells have formed clumps in the host embryo, while the donor-derived PGCs are located in the gonadal region. (C) Goldfish-to-zebrafish BT chimera. The transplanted somatic cells have formed large aggregations and some of the PGCs are located in proximity to the somatic cells. (D) Loach-to-zebrafish BT chimera. The transplanted somatic cells are tightly aggregated around the embryonic head region and the PGCs are located close to the aggregation. (E) Loach-to-zebrafish BT chimera. In this chimera, the transplanted cells (arrow) localized around head region and disrupted development of optic structure of host embryo (arrowhead). Arrows in A-D indicate the donor-derived PGCs. Arrowheads in A-D indicate the donor cell aggregations. Scale bar indicates 500 μm. |

The transplanted donor PGC localized at the gonadal region of the host embryo and started to proliferate at the same time as the host PGCs during gonadal development. Donor and host PGCs were labeled with GFP or RFP, respectively. The lower column showed an enlarged image of the boxed areas in the upper column. (A) 24 hpf chimera. A transplanted single PGC was localized, along with host PGCs, at the position where the gonad will develop. (B) 7 dpf chimera. A GFP-labeled PGC had divided once at this stage (arrow) and some of the host PGCs had also started to proliferate. PGCs still lay loosely at this stage. (C) 11 dpf chimera. Both donor and host PGCs continued to proliferate and the PGCs began to form a tighter cluster than previously. (D) 14 dpf chimera. Both donor and host PGCs proliferated and became smaller. Arrows indicate a transplanted single donor PGC. Arrowheads indicate reflected fluorescence of labeled PGCs on gas bladder. Scale bar in upper column indicates 500 μm. Scale bar in lower column indicates 100 μm. |