
Fig. 7
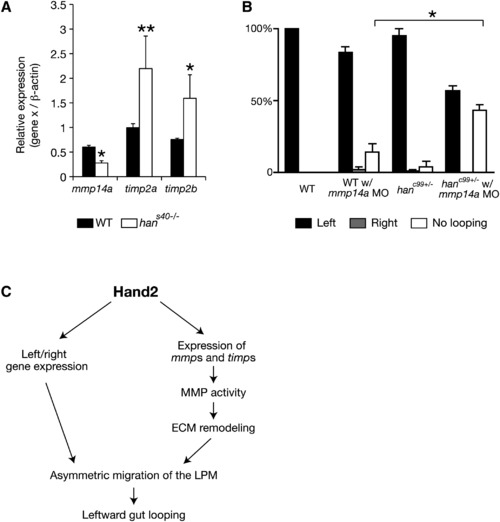
Expression of mmp Genes and Their Inhibitors Is Altered in hand2 Mutants (A) Comparison of mmp and timp expression in wild-type and hans40-/- samples by quantitative real-time PCR (two independent experiments, three replicates of wild-type and hans40-/- samples each time). The results are represented as relative expression levels that are normalized to β-actin (mean ± SEM). (B) Proportion (mean ± SEM) of wild-type embryos (n = 29), wild-type embryos injected with 0.5 ng of mmp14a MO (n = 44), hanc99 heterozygotes (n = 55), and hanc99 heterozygotes injected with 0.5 ng of mmp14a MO (n = 70) showing gut-looping phenotypes according to foxa3 expression. Three independent experiments were conducted. (A and B) Asterisks indicate statistical significance: *p < 0.05; **p < 0.01. (C) Diagram of Hand2 regulating asymmetric LPM migration during zebrafish gut-looping morphogenesis. See also Figure S4. |
| Genes: | |
|---|---|
| Fish: | |
| Anatomical Term: | |
| Stage: | Prim-5 |
| Fish: | |
|---|---|
| Knockdown Reagent: | |
| Observed In: | |
| Stage: | Prim-15 |
Reprinted from Developmental Cell, 18(6), Yin, C., Kikuchi, K., Hochgreb, T., Poss, K.D., and Stainier, D.Y., Hand2 Regulates Extracellular Matrix Remodeling Essential for Gut-Looping Morphogenesis in Zebrafish, 973-984, Copyright (2010) with permission from Elsevier. Full text @ Dev. Cell