
FIGURE
Fig. S2
Fig. S2
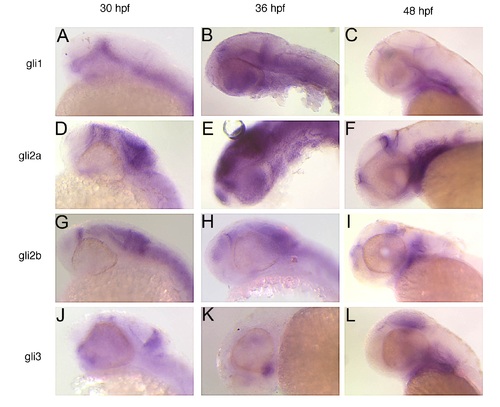
Expression of gli genes in craniofacial region during second day of development. Lateral views, anterior to the left, of 30 hpf (A,D,G,J), 36 hpf (B,E,H,K) or 48 hpf (C,F,I,L) stained with riboprobe for gli1 (A–C), gli2a (D–F), gli2b (G–I) or gli3 (J–L). |
Expression Data
Expression Detail
Antibody Labeling
Phenotype Data
Phenotype Detail
Acknowledgments
This image is the copyrighted work of the attributed author or publisher, and
ZFIN has permission only to display this image to its users.
Additional permissions should be obtained from the applicable author or publisher of the image.
Full text @ PLoS One