|
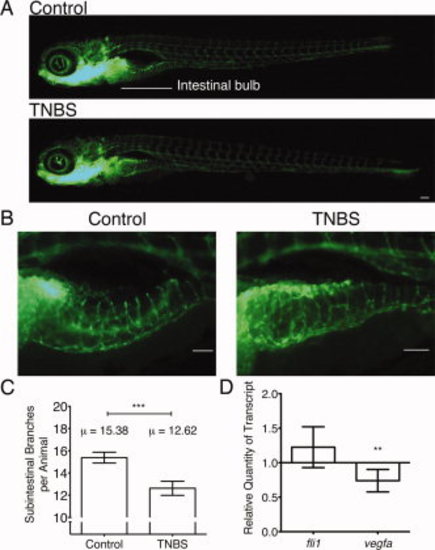
Intestinal vasculature is disrupted by trinitrobenzene sulfonic acid (TNBS) exposure. A: Comparison of vasculature in live 6 days postfertilization (dpf) TG(fli1a:EGFP)γ1 transgenic larvae imaged under epifluorescence with a GFP filter and (B) representative close up images. Scale bars represent 100 μm. C: Quantification of intestinal bulb vasculature at 6 dpf; mean numbers of subintestinal branches as indicated (n = 45). D: Quantitative polymerase chain reaction analysis of fli1 and vegfa transcription in 6 dpf larvae exposed to TNBS, shown relative to controls (RQ = 1; n = 10, pools of 20 larvae). All error bars represent a 95% confidence interval of the mean, P values calculated by t-test. **P < 0.01, ***P < 0.001.
|