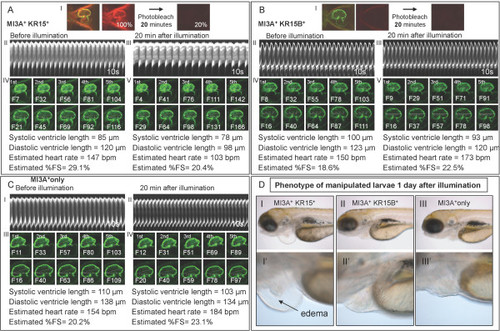
A reduction in cardiac output was observed in KR-expressing larvae immediately after illumination. (A-C) Heartbeat and contractility in SqKR15/ET33-mi3A (A), SqKR15B/ET33-mi3A (B) and KR-negative Sq ET33-mi3A (C) 3dpf larvae before illumination and 20 min after illumination. Panel (I) in (A-B) shows confocal images of corresponding double transgenic larvae, taken at the same gain setting, before and after illumination. M-modes depicting a heartbeat for 10 sec before and after illumination are in panels A-B, II-III and C, I-II. Images of five consecutive ventricular systole and diastole are shown in A-B, IV-V and C, III-IV. Cardiac output was specifically reduced after illumination of SqKR15/ET33-mi3A larva as the reduction in heartbeat is accompanied by a decrease in contractility indicated by a decrease in value of %FS. (D) Larvae at 4dpf, one day after illumination: (I) - SqKR15/ET33-mi3A (sample), (II) - SqKR15B/ET33-mi3A with skin mem-KR expression as a positive control and (III) - SqET33-mi3A as a negative control. Only SqKR15/ET33-mi3 developed prominent cardiac edema next day after illumination [D (I-I′)].
|
