FIGURE

Fig. S6

ID
ZDB-FIG-101122-18
Publication
Valentin et al., 2007 - The chemokine SDF1a coordinates tissue migration through the spatially restricted activation of Cxcr7 and Cxcr4b
Other Figures
All Figure Page
Back to All Figure Page
Fig. S6

Phenotypic Analysis of Cxcr7 Morphants
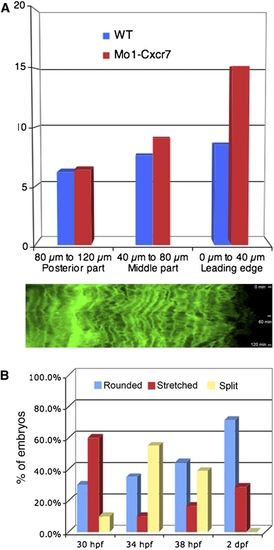
(A) Quantification of cell length in wild-type and Cxcr7MO1-injected embryos at different positions along the primordium. Distances of kymograph traces at the indicated positions (posterior part, middle part, and leading part) were averaged over three different time points (12 min, 58 min, and 90 min). The diagram shows that cells at the leading edge are more stretched in the Cxcr7 morphant compared to those of a wild-type primordium.
(B) Evolution of the primordium morphologies (round, stretch, break) through time, after Cxcr7Mo treatment. For each time point, 40 embryos were counted.

Expression Data

Expression Detail
Antibody Labeling
Phenotype Data
Fish:
Knockdown Reagent:
Observed In:
Stage: Prim-15

Phenotype Detail
Acknowledgments
This image is the copyrighted work of the attributed author or publisher, and ZFIN has permission only to display this image to its users. Additional permissions should be obtained from the applicable author or publisher of the image. Full text @ Curr. Biol.