
Fig. S2
- ID
- ZDB-FIG-100816-27
- Publication
- Rhodes et al., 2010 - Positive regulation of c-Myc by cohesin is direct, and evolutionarily conserved
- Other Figures
- All Figure Page
- Back to All Figure Page
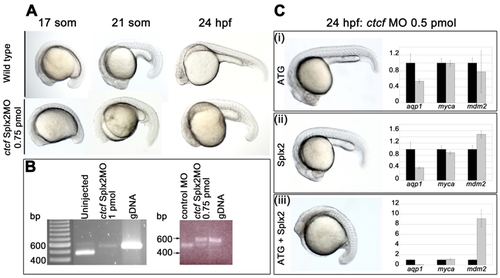
Targeting of zebrafish ctcf with antisense morpholino oligonucleotides. The ctcfSplx2-MO, 5′-CCAAAACAGATCACAAACCTGAAAG-3′ and the ctcfATG-MO, 5′-CATGGGTAATACCTACATTGGTTAA-3′ were designed using the ctcf sequence available at Ensembl (ENSDARG00000056621). The Splx2 morpholino targets the 3′ donor of exon 2, while the ATG morpholino targets the 5′ acceptor of exon 2 plus the ATG start codon. Both morpholinos should disrupt the splicing of both identified splice variants of ctcf. A, morphology of ctcfSplx2 morphants compared with wild type embryos at the indicated stages. 0.75 pmol of the ctcf morpholino was injected for each time point. Injection of the ctcfATG-MO at the higher dose of 1 pmol generated an identical phenotype (not shown). B, ctcf mRNA splicing is blocked by the ctcfSplx2-MO. cDNA was prepared from 24 h.p.f. zebrafish embryos. The electrophoretograms show RT-PCR products generated from cDNA. PCR primers used were Dr-CTCFsplx2-F 5′ATGATGATGGAAACCCTGGA 3′ (in exon 2) and Dr-CTCFsplx2-R1 5′ TCTTCATTTTGGGGTTCAGC 3′ (in exon 3); the larger 541 bp product in morphants corresponds to non-splicing of intron 2. Non-splicing is predicted to lead to a truncated protein. Left panel; intron 2 splicing of ctcf transcripts is abolished in surviving 24 h.p.f. embryos treated with 1 pmol Splx2-MO (uninjected embryos and genomic DNA used here as a reference). NB, this dose of MO elicits a 70% mortality rate with survivors severely disrupted/delayed. We therefore chose to use 0.75 pmol as an optimal dose (15% mortality, phenotype shown in A). Right panel; intron 2 splicing is significantly disrupted in embryos injected with 0.75 pmol ctcfSplx2-MO, compared with embryos treated with a control morpholino (control MO, Standard Negative Control Morpholino from GeneTools LLC). C, The ctcfATG-MO and ctcfSplx2-MO synergize to produce a more severe phenotype. (i), (ii), Each morpholino injected singly (0.5 pmol dose) generates a mild morphological phenotype (embryos on left) and modest changes in the transcription levels of aqp1 and mdm2 (graphs on right). (iii), In combination (0.5 pmol each), the two MOs elicit severe developmental delay (embryo on left) combined with dramatic downregulation of aqp1 and upregulation of mdm2 (graph on right). For (i)-(iii) myca expression is unchanged, regardless of MO identity or dose. Graphs represent gene expression of morphants (gray bars) relative to wild type (black bars). |
| Fish: | |
|---|---|
| Knockdown Reagents: | |
| Observed In: | |
| Stage Range: | 14-19 somites to Prim-5 |
Reprinted from Developmental Biology, 344(2), Rhodes, J.M., Bentley, F.K., Print, C.G., Dorsett, D., Misulovin, Z., Dickinson, E.J., Crosier, K.E., Crosier, P.S., and Horsfield, J.A., Positive regulation of c-Myc by cohesin is direct, and evolutionarily conserved, 637-649, Copyright (2010) with permission from Elsevier. Full text @ Dev. Biol.