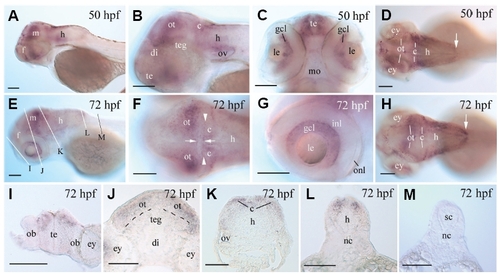
Pcdh19 expression in older embryos. Pcdh19 expression in 50 hpf (A-D) and 72 hpf (the remaining panels) embryos. (A-H) Whole mount embryos showing lateral views (anterior to the left and dorsal up) of the anterior fish (A,E), head (B) and eye (G). (C) Ventral view of the head (dorsal up), while (D,F,H) are dorsal views (anterior to the left). The arrow in (D,H) points to the posterior border of Pcdh19 expression domain in the hindbrain, while the arrowheads in (F) indicate the boundary of the mid-hindbrains. The apposing arrows in (F) indicate the area between the posterior border of the optic tectum and boundary of the mid-hindbrains with reduced Pcdh19 expression. (I-M) Cross sections (dorsal up) with their section levels indicated in (E). The dashed lines in (J) indicate the boundary between the optic tectum and tegmentum. Abbreviations: f, forebrain; gcl, retinal ganglion cell layer; inl, inner nuclear layer; m, midbrain; onl, outer nuclear layer. Other abbreviations are as in Fig. 4. Scale bars, 100 μm.
|
