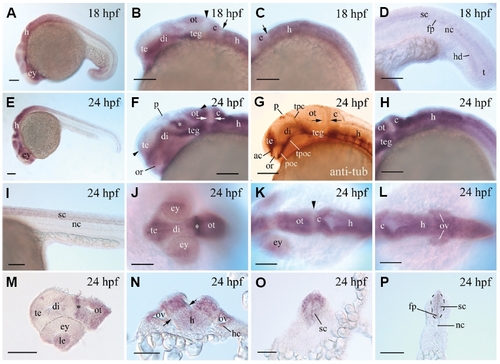
Pcdh19 expression in 18 and 24 hpf zebrafish embryos. (A-F) and (H-L) Whole mount embryos labeled with Pcdh19 cRNA. (G) is the head region of a whole mount embryo labeled with the anti-acytelated tubulin antibody. (A,E) Lateral views of the entire embryos (head towards the lower left corner). (B,F) Lateral views of the fore- and midbrains, while (C,H) are lateral views of the hindbrain (anterior to the left, dorsal up). (J,K,L) Dorsal views of the head region (anterior to the left). (D,I) Lateral views of the posterior half of the body and midtrunk region, respectively (anterior to the left). The arrowhead in (B,K), and the opposing arrows in (F,G) indicate the same region with reduced Pcdh19 expression, located between the posterior border of the optic tectum and boundary of the midhindbrains. The arrow in (B,C) point to the same area with reduced Pcdh19 expression, located immediately posterior to the cerebellum. The asterisk in (F,J,M) points to the same Pcdh19 expressing area in the dorsal thalamus. (M-P) Sections from whole mount embryos processed for Pcdh19 in situ hybridization. The apposing arrowheads in (F) indicate the plane of section for the image in (M) (anterior to the left), while (N-P) are cross sections (dorsal up) at the otic vesicle (ov), anterior-trunk, and mid-trunk regions, respectively. The opposing arrows in (N) indicate a band of tissue with reduced Pcdh19 staining. Other abbreviations: ac, anterior commissure; c, cerebellum; di, diencephalon; fp, floor plate of the spinal cord; h, hindbrain; hc, hair cells; hd, hypochord; le, lens; nc, notochord; or, optic recess; ot, optic tectum; p, pineal organ; poc, postoptic commissure; sc, spinal cord; te, telencephalon; teg, tegmentum; tpc, tract of posterior commissure; tpoc, tract of postoptic commissure. The remaining abbreviations are the same as in Fig. 4. Scale bars,100 μm for (A-M), and 50 μm for (N-P=.
|
