|
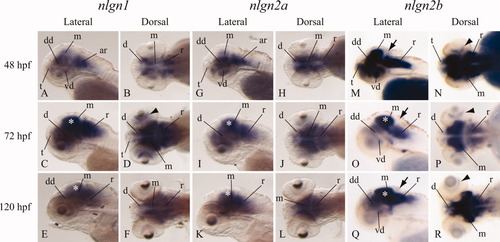
Temporal and spatial expression patterns of nlgn1, nlgn2a, and nlgn2b. Whole mount in situ hybridization assays were performed on embryos at 48, 72, and 120 hr post-fertilization (hpf). A-F: nlgn1 is mainly expressed in midbrain, hindbrain, and also in discrete regions of the diencephalon. At 72 hpf, a strong signal is visible throughout the whole brain. G-L: The expression of nlgn2a mRNA is similar to nlgn1. M-R: nlgn2b is widely detected at stage 48 hpf in the brain (with the exception of cerebellum, black arrows), and, unlike nlgn2a, in the retina (black arrowheads). From 72 hpf, the signal is detectable mainly in midbrain (especially in the tectum opticum, white asterisks), hindbrain, and discrete regions of the forebrain. Embryos are mounted with anterior to the left and dorsal up. ar, anterior rhomboencephalon; d, diencephalon; dd, dorsal diencephalon; m, mesencephalon; r, rhomboencephalon; t, telencephalon; vd, ventral diencephalon.
|