|
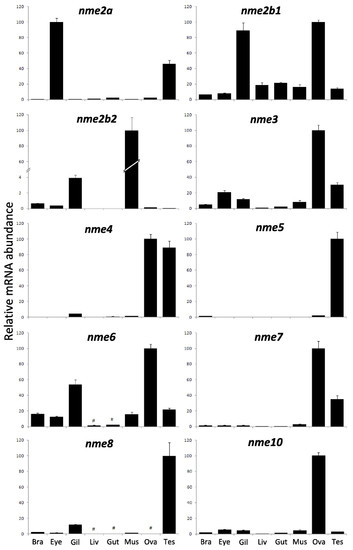
Tissue distribution of zebrafish nme mRNAs. Tissue expressions of zebrafish nme2a, nme2b1, nme2b2, nme3, nme4, nme5, nme6, nme7, nme8, and nme10. Real-time PCR analysis was conducted using total RNA originating from the following tissues sampled in three different sexually-mature females: brain (Bra), eyes (Eye), gills (Gil), hepatopancreas (Liv), intestine (Gut), muscle (Mus), ovary (Ova), and three different mature males: testis (Tes). For each tissue, three separate reverse transcription (RT) reactions were carried out using separate RNA samples originating from three different fish. RT reactions were pooled and use to run real-time PCR in quadruplicates. Mean and SD are shown (n = 4). #, Expression levels not significantly different from background signal at p < 0.05. For all genes, relative abundance is expressed in percentage of highest tissue expression after signal normalization by 18S gene expression.
|