
Fig. 6
- ID
- ZDB-FIG-091002-16
- Publication
- Liu et al., 2009 - Expression of protocadherin-9 and protocadherin-17 in the nervous system of the embryonic zebrafish
- Other Figures
- All Figure Page
- Back to All Figure Page
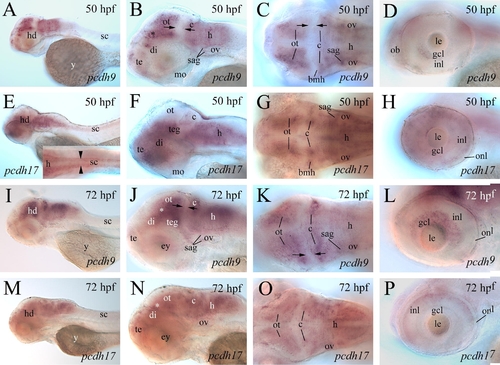
Pcdh9 and Pcdh17 expression in 50 hpf and 72 hpf embryos. (A–D, I–L) From whole mount embryos processed for Pcdh9 in situ hybridization, while (E–H, M–P) are whole mount embryos labeled with Pcdh17 cRNA probe. All lateral views have anterior to the left and dorsal up, while dorsal views have anterior to the left. (A, E, I and M) Lateral views of the anterior half of the embryos showing overall patterns of Pcdh9 or Pcdh17 expression. (B, F, J and N) Lateral views of the head region. (C, G, K and O) Dorsal views of the mid- and hindbrains. (D, H, L and P) Lateral views of the retina. The apposing arrows in (B, C, J and K) indicate the area between the posterior border of the optic tectum and boundary of the mid-hindbrains with reduced Pcdh9 expression. The opposing arrowheads in (E) insert indicate Pcdh17 expression in the spinal cord. Abbreviations: bmh, boundary of mid- and hindbrains; gcl, retinal ganglion cell layer; inl, inner nuclear layer; onl, outer nuclear layer. Other abbreviations are the same as in Fig. 4 and Fig. 5. |
| Genes: | |
|---|---|
| Fish: | |
| Anatomical Terms: | |
| Stage Range: | Long-pec to Protruding-mouth |
Reprinted from Gene expression patterns : GEP, 9(7), Liu, Q., Chen, Y., Pan, J.J., and Murakami, T., Expression of protocadherin-9 and protocadherin-17 in the nervous system of the embryonic zebrafish, 490-496, Copyright (2009) with permission from Elsevier. Full text @ Gene Expr. Patterns