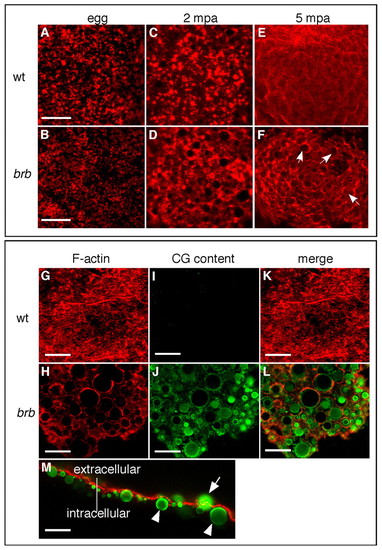
CGE is defective in brom bones mutants. (A,B)F-actin distribution in wild-type (A) and brom bones mutant (B; 100%, n=28) zebrafish eggs prior to egg activation. (C,E) F-actin distribution in wild-type eggs at 2 (C) and 5 (E) mpa. (D,F) Abnormal F-actin distribution in brom bones mutant eggs at 2 (71%, n=35) and 5 (77%, n=49) mpa. The remaining mutant eggs showed F-actin distribution similar to wild-type eggs. Arrows in F highlight some of the circular profiles evident in mutant eggs. (G-L) F-actin (red) and CG content (green) distribution in wild-type (G,I,K) and brom bones mutant (H,J,L) eggs at 30 mpa (100%, n=71 brom bones mutant eggs). (M) Lateral view of a mutant egg surface at 5 mpa shows the localization of CG cores with respect to the F-actin meshwork. Arrow indicates a non-exocytosed granule within the F-actin meshwork; arrowheads indicate non-exocytosed granules beneath the F-actin meshwork. C-F are 20x magnification images; A-L are z-stacks of confocal images, M is a single confocal section. Scale bars: 10 μm in A,B; 20 μm in G-M.
|
