
Fig. 3
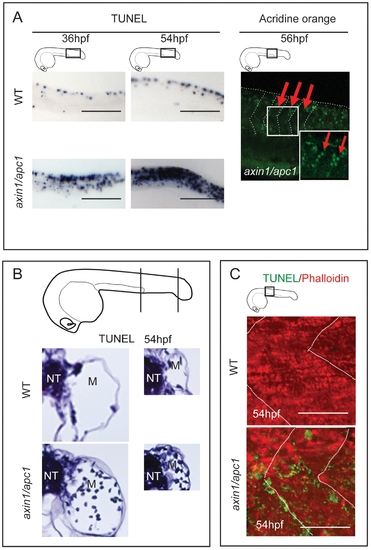
Apoptosis at somite boundaries and muscle fibers. (A) From 36 hpf onwards, axin1/apc1 embryos show an increase in apoptosis as labeled by TUNEL. Insets show the imaged area. Scale bar, 100 μm. Apoptotic cells labeled with acridine orange lining up at the somites boundaries, right panel. Arrows and lines mark the somite boundaries. Scale bar, 25 μm. (B) TUNEL labeling at 54 hpf show an increase in apoptotic cells in the myotome. Cartoon depicts the level of sectioning i.e. left panel at the posterior end of the yolk extension and right panel posterior end of the tail. NT-neural tube; M-myotome. (C) Co-labeling of fluorescent TUNEL assay (apoptotic cells) and phalloidin labeling (muscle fibers), left and middle panel. This CLSM image was taken caudal to the yolk extension, at a single z-plane of 5 μm of fast muscle fibers. |