
FIGURE
Fig. S1
- ID
- ZDB-FIG-090424-16
- Publication
- Burzynski et al., 2009 - Characterization of spatial and temporal expression pattern of SCG10 during zebrafish development
- Other Figures
- All Figure Page
- Back to All Figure Page
Fig. S1
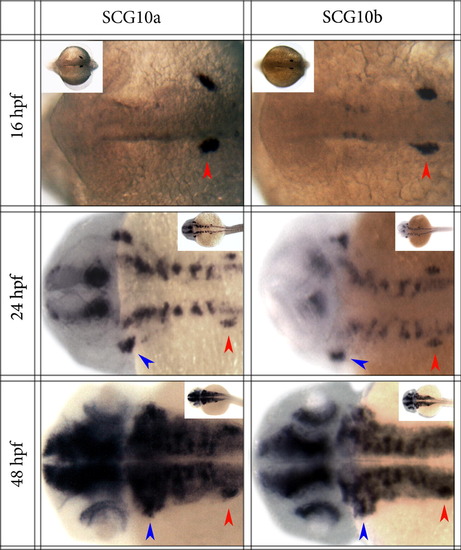
Comparison of the pattern of expression in the anterior CNS between SCG10a and SCG10b genes at 16, 24 and 48 hpf stages. Dorsal view of the anterior CNS. Anterior is to the left. Red arrowheads indicate posterior lateral line ganglia; blue arrows indicate the anterior lateral line ganglia. |
Expression Data
Expression Detail
Antibody Labeling
Phenotype Data
Phenotype Detail
Acknowledgments
This image is the copyrighted work of the attributed author or publisher, and
ZFIN has permission only to display this image to its users.
Additional permissions should be obtained from the applicable author or publisher of the image.
Reprinted from Gene expression patterns : GEP, 9(4), Burzynski, G.M., Delalande, J.M., and Shepherd, I., Characterization of spatial and temporal expression pattern of SCG10 during zebrafish development, 231-237, Copyright (2009) with permission from Elsevier. Full text @ Gene Expr. Patterns