
Fig. 4
- ID
- ZDB-FIG-090424-14
- Publication
- Burzynski et al., 2009 - Characterization of spatial and temporal expression pattern of SCG10 during zebrafish development
- Other Figures
- All Figure Page
- Back to All Figure Page
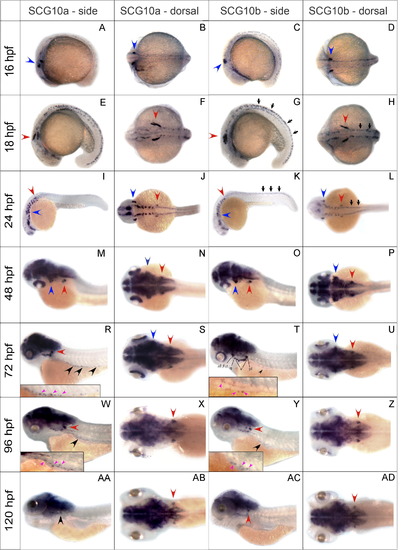
Temporal and spatial expression pattern of SCG10a and SCG10b genes. Wholemount in situ hybridized embryos hybridized with either an SCG10a (A, B, E, F, I, J, M, N, R, S, W, X, AA, AB) or an SCG10b (C, D, G, H, K, L, O, P, T, U, Y, Z, AC, AD) antisense riboprobes at the indicated developmental stages. The first and third columns show lateral views, while the second and fourth columns show dorsal views. Inserts in panels R, T, W, Y are close up views of the intestine. Anterior is to the left. Red arrowheads indicate posterior lateral line ganglia; blue arrows indicate the anterior lateral line ganglia; black arrowheads indicate developing enteric neurons in the gut; small black arrows (G, H, K, L) indicate Rohon-Beard neurons; pink arrows (R, T, W, Y) indicate enteric neurons expressing SCG10a and SCG10b. Abbreviations in (T), al, anterior lateral line; t, trigeminal ganglia; f, facial ganglia; g, glosso-pharyngeal ganglia; v, vagal ganglia; pl, posterior lateral line ganglia; retina is indicated. |
Reprinted from Gene expression patterns : GEP, 9(4), Burzynski, G.M., Delalande, J.M., and Shepherd, I., Characterization of spatial and temporal expression pattern of SCG10 during zebrafish development, 231-237, Copyright (2009) with permission from Elsevier. Full text @ Gene Expr. Patterns