
Fig. 5
- ID
- ZDB-FIG-090424-15
- Publication
- Burzynski et al., 2009 - Characterization of spatial and temporal expression pattern of SCG10 during zebrafish development
- Other Figures
- All Figure Page
- Back to All Figure Page
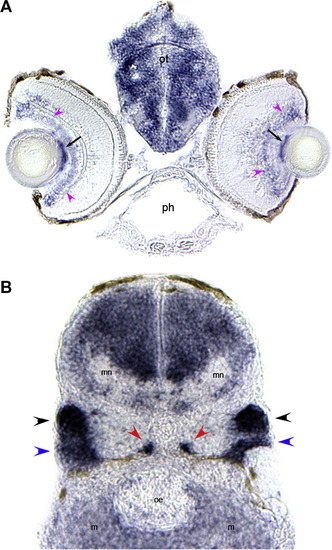
Expression of SCG10a in the CNS. Transverse sections of 96 hpf larvae hybridized with an SCG10a riboprobe. (A) section taken at the level of the eyes and the anterior optic tectum; pink arrowheads indicate retinal ganglion cell layer; black arrows indicate the region posterior to the lens, close to the optic nerve head;. (B) section taken through the posterior hindbrain; black arrowheads indicate the posterior lateral line ganglia; blue arrowheads indicate the vagal ganglia; red arrowheads indicate the sympathetic ganglia chains; abbreviations: ot, optic tectum; ph, pharynx; mn, motor neurons region; oe, esophagus; m, mesenchyme. |
| Gene: | |
|---|---|
| Fish: | |
| Anatomical Terms: | |
| Stage: | Day 4 |
Reprinted from Gene expression patterns : GEP, 9(4), Burzynski, G.M., Delalande, J.M., and Shepherd, I., Characterization of spatial and temporal expression pattern of SCG10 during zebrafish development, 231-237, Copyright (2009) with permission from Elsevier. Full text @ Gene Expr. Patterns