
Fig. 4
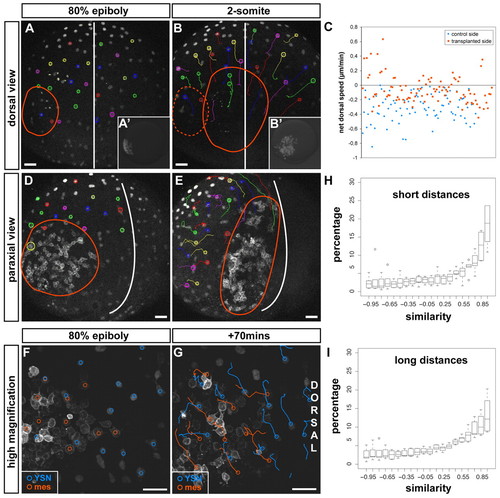
Mesendoderm directs iYSN convergence movements. (A,B,D,E) Trajectories of iYSN in MZoep embryos containing transplanted mesendoderm cells at 80% epiboly (8 hpf; A,D, startpoint of tracks) and at the two-somite stage (11 hpf; B,E, endpoint of tracks). The red line marks the position of the transplanted cells. (A,B) iYSN convergence movements at the side of MZoep embryos containing transplanted mesendoderm cells versus iYSN on the untransplanted side. Dorsal view. (A′,B′) Images of rhodamine dextran-labeled transplanted cells in the same MZoep embryo in A,B before (8 hpf; A′) and after (11 hpf; B′) the timelapse. (C) Quantification of iYSN net dorsal speed shows that iYSN convergence movements at the side containing transplanted mesendoderm cells is significantly increased compared with the convergence of iYSN at the untransplanted side (P<0.0001; n=197 iYSN from four embryos). Unpaired Student's t-tests were performed to test the differences between the mean values. (D,E) Paraxial view of a transplanted MZoep embryo shows that lateral iYSN moving behind the transplanted cells (labeled with membrane-bound GFP) undergo convergence movements similar to the transplanted cells. (F,G) Trajectories of iYSN (blue tracks) and transplanted cells labeled with membrane-bound GFP (orange tracks) in a transplanted MZoep embryo at 80% epiboly (8 hpf; F, startpoint of tracks) and 70 minutes later (G, endpoint of tracks). Images are z-projections. Dorsal is towards the right and animal is towards the top. iYSN underneath and in front of the transplanted cells move dorsally and posteriorly together with the cells. (H,I) Quantification of movement similarity between iYSN and transplanted cells. Histograms of the similarity values were generated separately for each experiment (n=6). Boxplots show the distribution of the bin heights among the experiments. Circles indicate outliers. (H) Similarity at short distances (0-40 μm). On average, 54% of the values are higher than 0.5. (I) Similarity at long distances (80-120 μm). On average, 48% of the values are higher than 0.5. Considering all distances together, 50% of the values are higher than 0.5 (not shown). Scale bars: 50 μm. |