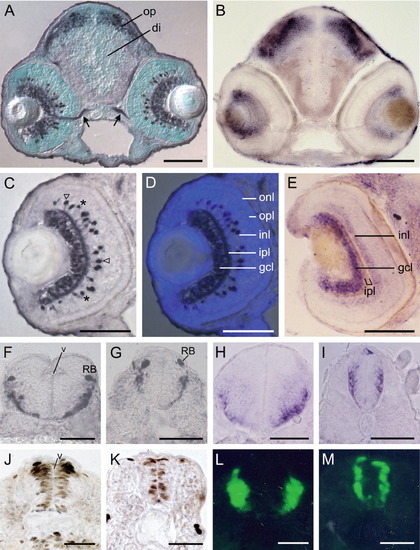
GFP expression in head and trunk regions of Tg(scn8aa:GFP) line at 72 hpf. A: Coronal sections of the head are labeled for GFP antibody and counterstained with methyl green. GFP protein is detected in the retina, optic nerve (arrows), and optic tectum (op), but not in the diencephalon (di). B: Expression pattern of scn8aa mRNA in the brain. C: GFP expression in the retinal ganglia and a subset of interneurons. Open arrowheads show interneurons in the inner nuclear layer with axonal processes. Asterisks show interneurons without axon outgrowth. D: Merged image of the bright field image in C and a corresponding image of DAPI staining. E: Scn8aa mRNA expression in the retinal ganglia cell layer (gcl) and inner nuclear layer (inl). F-I: Cross-sections show GFP expression (F, G) and scn8aa mRNA expression (H, I) in the lateral region of the spinal cord. J, K: BrdU-positive cells at the ventricular zone (v) of the hindbrain and spinal cord. L, M: Early-differentiated neurons of the hindbrain and spinal cord labeled by anti-HuC antibody. ipl, inner plexiform layer; onl, outer nuclear layer; opl, outer plexiform layer; RB, Rohon-Beard neurons. Scale bars = 100 μm for A-E and 50 μm for F-M.
|
