
Fig. S1
- ID
- ZDB-FIG-080604-45
- Publication
- Chi et al., 2008 - Genetic and Physiologic Dissection of the Vertebrate Cardiac Conduction System
- Other Figures
- All Figure Page
- Back to All Figure Page
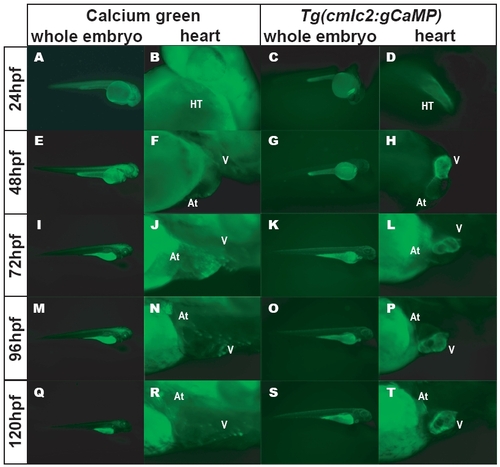
Comparison of Calcium-Green–Injected Embryos versus Stable Tg(cmlc2:gCaMP)s878 Embryos (B, F, J, N, R) Higher magnification epifluorescence micrographs of calcium-green-injected embryos focusing on the hearts at 24, 48, 72, 96, and 120 hpf. Weaker calcium-green fluorescence is observed as the embryos develop. (C, G, K, O, S) Epifluorescence micrographs of Tg(cmlc2:gCaMP)s878 live embryos at 24, 48, 72, 96, and 120 hpf. Specific gCaMP fluorescence is detected only in hearts. Autofluorescence is detected in the yolk. (D, H, L, P, T) Higher magnification epifluorescence micrographs of Tg(cmlc2:gCaMP)s878 embryos focusing on the hearts at 24, 48, 72, 96, and 120 hpf. Autofluorescence from yolk does not interfere with imaging the hearts. |
| Gene: | |
|---|---|
| Fish: | |
| Anatomical Terms: | |
| Stage Range: | Prim-5 to Day 5 |