
Fig. 2
- ID
- ZDB-FIG-080604-38
- Publication
- Chi et al., 2008 - Genetic and Physiologic Dissection of the Vertebrate Cardiac Conduction System
- Other Figures
- All Figure Page
- Back to All Figure Page
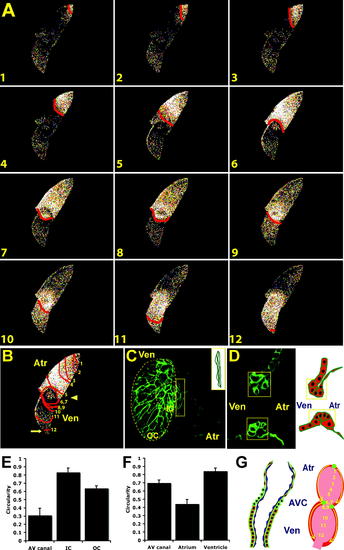
Development of AV Myocardium Results in AV Conduction Delay and Development of the Central CCS (B) The 48 hpf optical maps of calcium excitation represented by isochronal lines every 60 ms. Significant conduction delay was observed at the AV junction (arrowhead) and OFT (arrow). (C) Surface and (D) cross-sectional analyses of Tg(cmlc2:eGFP-ras)s883 hearts at 48 hpf reveal distinct cellular morphologies and orientations among atrial, ventricular, and AV (yellow boxes) cardiomyocytes. Schematic illustration of AV canal region to the right. OC and IC are outlined on projection of ventricle in (C). (E and F) Bar graphs represent cell morphology/circularity measurements of Tg(cmlc2:eGFP-ras)s883 hearts at 48 hpf: (E) surface of cardiomyocytes from the OC and IC of the ventricle as well as the AV myocardium and (F) atrial, ventricular, and AV canal cardiomyocytes on cross-sectional analysis. (G) Schematic representation of a 48 hpf heart. Individual cardiomyocytes are outlined in green. Endocardium is in blue. Numbers indicate temporal sequence of calcium activation in the heart. Yellow arrows indicate direction of cardiac conduction. Green circles indicate slow conduction pathway/pacemaker and AV conduction delay. Atr, atrium; Ven, ventricle; AVC, AV canal. |
| Gene: | |
|---|---|
| Fish: | |
| Anatomical Terms: | |
| Stage: | Long-pec |