
Fig. 4
- ID
- ZDB-FIG-080505-28
- Publication
- Parvin et al., 2008 - Autoregulatory loop and retinoic acid repression regulate pou2/pou5f1 gene expression in the zebrafish embryonic brain
- Other Figures
- All Figure Page
- Back to All Figure Page
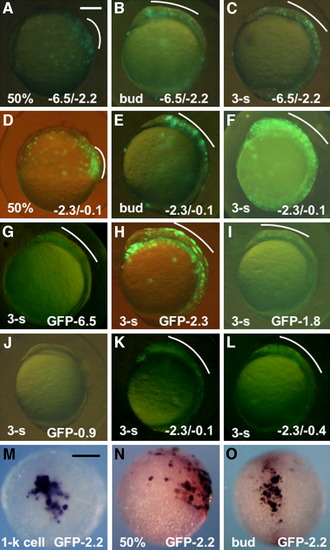
Regulatory activities of the subregions in the upstream DNA of pou2. A-F: Expression of the reporter (GFP-0.1) under regulation of the -6.5/-2.2 (A-C) and -2.3/-0.1 (D-F) fragments at 50% epiboly (A,D), bud stage (B,E), and three-somite stage (C,F). G-J: Expression of the green fluorescent protein (GFP) constructs under regulation by different regions of the pou2 upstream DNA at early somite stages. K,L: Expression of GFP-0.1 co-injected with -2.3/-0.1 (K) and -2.3/-0.4 (L) at early somite stages. M-O: mRNA expression of GFP-2.2, as revealed by whole-mount in situ hybridization, at the 1-k cell (M), 50% epiboly (N), and bud (O) stages. GFP expression in the dorsal blastoderm and head regions are marked with white curves. A-L,N: Lateral views with anterior to the top and dorsal to the right. M: Animal view. O: Dorsal view with anterior to the top. Scale bar = 200 μm. |