
Fig. 1
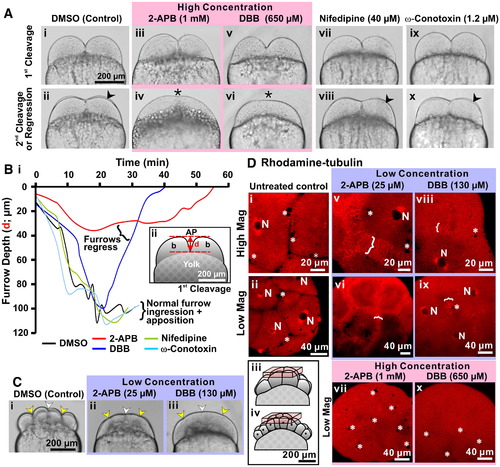
An elevation in [Ca2+]i is required for furrow deepening and maintenance. (A) Embryos were treated after furrow positioning of the 1st cleavage with the IP3R antagonist, 2-APB, with the L- and N-type voltage gated Ca2+ channel blockers, nifedipine and ω-conotoxin, respectively, or with the Ca2+ chelator, DBB at the concentrations indicated. Brightfield images were acquired during deepening of the 1st cleavage furrow and at the time of the appearance of the 2nd cleavage furrow (indicated by arrowheads in panels Aii, Aviii and Ax) or during regression of the 1st furrow (indicated by asterisks in panels Aiv and Avi). (B) Panel Bi shows a time-course of 1st cleavage furrow depth (distance measured is shown in panel Bii) during normal deepening and apposition in DMSO-control, nifedipine- and ω-conotoxin-treated embryos, as well as during abnormal deepening followed by furrow regression in 2-APB and DBB-treated embryos. (C) Brightfield images of three representative embryos that were treated with DMSO (control; panel Ci) or with low concentrations of 2-APB (panel Cii) or DBB (panel Ciii), which were acquired when the control embryo was undergoing deepening of the 3rd cleavage. Indentations in the blastoderm surface indicate the positioning of the 1st (white arrowheads) and 3rd cleavage furrows (yellow arrowheads) in both DMSO control and drug-treated embryos (see panels Ci to Ciii). (D) Embryos injected with rhodamine–tubulin and then either left untreated (panels Di and Dii) or else treated with a low concentration of 2-APB (25 μM; panels Dv and Dvi) or DBB (130 μM; panels Dviii and Dix), or a high concentration of 2-APB (1 mM; panel Dvii) or DBB (650 μM; panel Dx). Microtubules were visualized in all the embryos when the untreated control embryos reached the 8- to 16-cell stage. White brackets denote the furrow microtubule arrays (FMAs), while N denotes nuclei and * indicates yolk platelets; both of which take the form of unlabeled voids of a large and small dimension, respectively. The schematics (see panels Diii and Div) indicate the location within the untreated control 8- and 16-cell stage embryos of the stack of 2-D confocal sections used to reconstruct the images shown in the D panels. |
Reprinted from Developmental Biology, 316(2), Li, W.M., Webb, S.E., Chan, C.M., and Miller, A.L., Multiple roles of the furrow deepening Ca2+ transient during cytokinesis in zebrafish embryos, 228-248, Copyright (2008) with permission from Elsevier. Full text @ Dev. Biol.