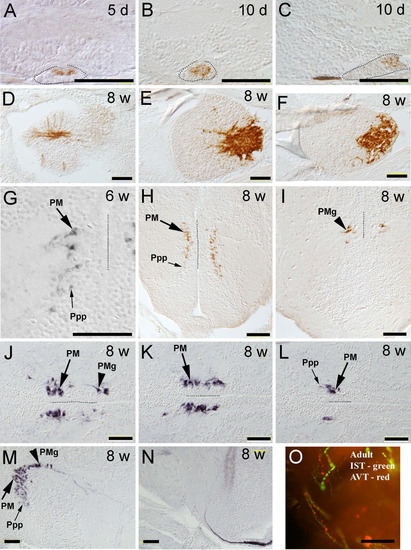
Ontogeny of arginine-vasotocin immunoreactivity (AVTir). The ontogeny of AVT nonapeptide expression was determined by chromogen immunohistochemistry using anti-teleost AVT antibodies. A: AVTir is first detected in the pituitary of larvae at 5 days postfertilization (d), frontal section. B,C: Frontal section (B) and sagittal section (C) show increased immunoreactivity (AVTir) in the pituitary at 10 days. The black dotted lines indicate the approximate outline of the pituitary, A-C. D-F: Horizontal sections at the level of the pituitary in 8-week-old (w) juveniles with rostral to the left, D is the most dorsal and F most ventral. D: AVTir fibers (neurohypophysial tract) entering the pituitary and partly spreading laterally. E: AVTir fibers and terminals in the dorsal and posterior pituitary. F: AVTir terminals restricted to the posterior portion of the pituitary. G: High magnification frontal section of 6-week juveniles, showing AVTir cell bodies and fibers. H-N: Sections demonstrate AVTir at the level of preoptic and hypothalamic areas of 8-week juveniles. H,I: Fritary. G: High magnification frontal section of 6-week juveniles, showing AVTir cell bodies and fibers. H-N: Sections demonstrontal sections, which most rostrally (H) show the dorsal (up) to ventral extent of parvocellular (Ppp; small arrows) and magnocellular (PM; large arrow) AVTir cells, and more caudally (I) shows gigantocellular neuronal subpopulation (PMg; arrowhead). J-L: Horizontal sections, rostral to the left, with J at the most dorsal level with both magnocellular and gigantocellular subpopulations, K and L with only magnocellular nucleus at mid- and the most ventral level. A dotted black line indicates the diencephalic ventricle in G-L. M and N are sagittal sections, rostral to the left. M: AVTir cells form an inverted L shape typically seen in teleosts and AVTir fiber bundles of the neurohypophysial tract course in a caudal-ventral direction of the hypothalamus. N: AVTir fiber bundles of the neurohypophysial tract course in the lateral portion of the hypothalamus toward the pituitary. O: Double-label immunofluorescence of a thick, frontal section of adult brain (30 μm) at the level of the rostral hypothalamus. AVTir (red) fibers and isotocin (IST) -immunoreactive (green) fibers course together through the lateral portion of the hypothalamus. Scale bars = 50 μm.
|
