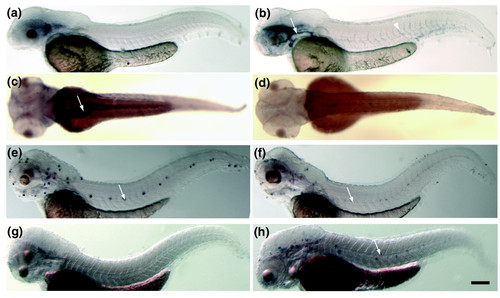
Examples of toxicant-responsive genes that are expressed in a highly tissue-restricted manner. (a) 48 hpf vehicle 3 control. Figure 1 indicated the exposure embryo from 96 to 120 hpf and (b) 500 ng/l TCDD-treated embryos hybridized to a cytochrome P450 1A1 antisense probe. TCDD-treated embryos showed increased levels of cytochrome P4501A1 mRNA in blood vessels Arrow, primary head sinus, arrowhead, intersegmental vessel. (c) 72 hpf vehicle control 1 and (d) 60 μg/l MeHg-exposed embryos hybridized to a glutathione peroxidase 1 probe. Embryos showed a reduction of mRNA levels in the gut (arrow). Embryos were treated from 4 to 72 hpf and were then fixed for in situ processing. (e) Control embryo and (f) 500 μg/l CdCl2-treated embryo hybridized to oncomodulin A antisense mRNA. Oncomodulin A mRNA levels are downregulated in the hair cells of the lateral-line organ (arrow) in response to Cd exposure. (g) Control and (h) Cd-treated embryos hybridized to a thioredoxin antisense probe. Thioredoxin is upregulated in the hair cells of the neuromasts (arrow). Embryos are oriented anterior to the left and dorsal up (a,b,e-h) or with dorsal side facing (c,d). Scale bar represents 220 μm.
|
