
Fig. 5
- ID
- ZDB-FIG-080205-6
- Publication
- Ishimaru et al., 2005 - Two families of candidate taste receptors in fishes
- Other Figures
- All Figure Page
- Back to All Figure Page
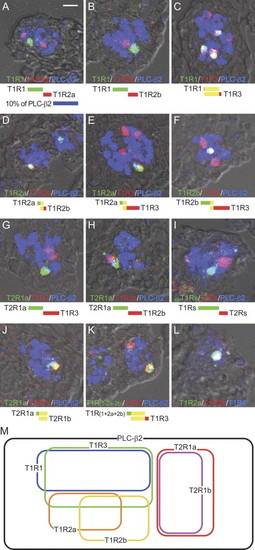
Relationships in expression among zfTRs. Sections of pharyngeal region were hybridized with three kinds of probes in the combinations indicated by colored letters at the bottom of the panels: zfTRs and zfPLC-β2 (A–K) and three zfTRs (L). The signals of probes were represented as pseudocolors (green, red and blue). A relative population of cells expressing each receptor gene to zfPLC-β2-expressing cells is represented by bar under the panels, and percentage of co-expression between zfTRs is illustrated with colors. The blue bar under the panel A represents 10% population of zfPLC-β2-positive cells. Scale bar=10 μm. (M) Venn diagram illustrating the relationships in zfTR expression. |
Reprinted from Mechanisms of Development, 122(12), Ishimaru, Y., Okada, S., Naito, H., Nagai, T., Yasuoka, A., Matsumoto, I., and Abe, K., Two families of candidate taste receptors in fishes, 1310-1321, Copyright (2005) with permission from Elsevier. Full text @ Mech. Dev.