
Fig. 3
- ID
- ZDB-FIG-070914-22
- Publication
- Muto et al., 2006 - Rab11-FIP4 is predominantly expressed in neural tissues and involved in proliferation as well as in differentiation during zebrafish retinal development
- Other Figures
- All Figure Page
- Back to All Figure Page
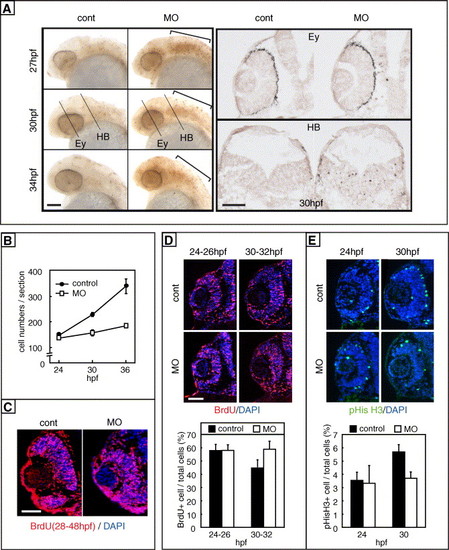
Impaired proliferation of retinal progenitors in zRab11-FIP4 morphants. (A) Cell death in the MO-injected embryos. Embryos injected with either control-MO (left column) or zRab11-FIP4-MO1 (right column) were subjected to the TUNEL assay using whole embryos (left panel) and tissue sections (right panel). (Left panel) Embryos fixed at 27, 30 and 34 hpf were analyzed. Excess cell death in the hindbrain region of the morphants is marked with brackets. (Right panel) Transverse sections prepared from control and the morphants at 30 hpf were analyzed. Sections at the levels of the eye (Ey) and hindbrain (HB) were used, and the positions are indicated in the left panel. (B) Increase in the retinal cell number during development as estimated by counting the cells in tissue sections. The cell number/retinal section at each time was calculated as the average of numbers scored from at least 17 (control, closed circles) or 23 (zRab11-FIP4 morphants, open squares) sections prepared from 4 to 5 embryos. Standard deviations are indicated as error bars. The differences are statistically significant at 30 and 36 hpf (P < 0.001 in each case) but not at 24 hpf (P > 0.1). (C) Proliferating cells in the retina were examined by a long-term incorporation of BrdU from 28 to 48 hpf. (D) Retinal cells in the S-phase were labeled by short-term (2 h) BrdU incorporation starting at either 24 or 30 hpf. (Upper panel) Transverse sections were immunostained with the anti-BrdU antibody. (Lower panel) The number of BrdU+ cells was counted, and the ratio to total cells was scored. Standard deviations are indicated as error bars. (E) Mitotic cells in the retina were immunostained with an anti-phospho-histone H3 antibody. (Upper panel) Immunostained mitotic cells in transverse sections are seen. (Lower panel) Ratios of mitotic cells (pHisH3+) to total cells in retinal sections of 24- and 30-hpf embryos were scored. In panels D and E, the differences between control and zRab11-FIP4 morphants are statistically significant at 30 hpf (BrdU; P = 0.01, pHisH3; P = 0.008) but not at 24 hpf (BrdU; P = 0.86, pHisH3; P = 0.75). Scale bars indicate 50 μm. |
| Fish: | |
|---|---|
| Knockdown Reagent: | |
| Observed In: | |
| Stage Range: | Prim-5 to Prim-15 |
Reprinted from Developmental Biology, 292(1), Muto, A., Arai, K.I., and Watanabe, S., Rab11-FIP4 is predominantly expressed in neural tissues and involved in proliferation as well as in differentiation during zebrafish retinal development, 90-102, Copyright (2006) with permission from Elsevier. Full text @ Dev. Biol.