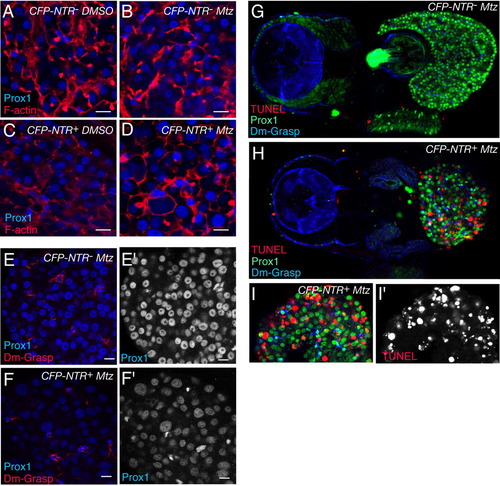
Hepatocyte damage mediated by the Nitroreductase/Metronidazole (NTR/Mtz) system. A-D: Confocal images of hepatic tissue of 7 days postfertilization (dpf) wild-type (A,B) and Tg(l-fabp:CFP-NTR)s891 (C,D) larvae exposed to dimethyl sulfoxide (DMSO) alone (A,C), or to10 mM Mtz (B,D) from 4 to 7 dpf, immunostained for Prox1 (blue) and F-actin (red). E,E′,F,F′: Confocal images of liver tissue of 5 dpf wild-type (E,E′) and Tg(l-fabp:CFP-NTR)s891 (F,F′) larvae exposed to 10 mM Mtz from 2 to 5 dpf and immunostained for Prox 1 (blue) and Alcam (red). E′,F′: Prox1 channel of images E and F, respectively. Scale bars = 10 μm. G-I: Confocal images of transverse sections of a 7 dpf wild-type control larva (G) and of a Tg(l-fabp:CFP-NTR)s891 larva exposed to 10 mM Mtz from 4 to 7 dpf (H; magnified liver section, I, I′) immunostained for Prox1 (green), Alcam (blue), and terminal deoxynucleotidyl transferase-mediated deoxyuridinetriphosphate nick end-labeling (TUNEL, red). I′: Single channel confocal image of I showing TUNEL staining. A-D: Hepatocytes expressing CFP-NTR under the control of the l-fabp promoter, after treatment with Mtz from 4-7 dpf (D) show a different morphology from the respective controls: CFP-NTR-DMSO (A), CFP-NTR-Mtz (B), and CFP-NTR+ DMSO (C). In the damaged livers, hepatocytes show an abnormal shape and a significant increase in the size of the nuclei, marked by Prox1 expression (F,F′). However, bile duct cells (surrounded by Alcam expression) do not appear affected (in their nuclear shape or intensity of Prox1 expression; F,F′) compared with the CFP-NTR- control (E,E′). Immunostaining and TUNEL detection assay on transverse sections of Mtz-treated Tg(l-fabp:CFP-NTR)s891 larvae (H) vs. Mtz-treated CFP-NTR- larvae (G) reveal specific cell death in the liver (H,I,I′), whereas no, or almost no, cell death could be detected in nonhepatic tissue or in control larvae (G).
|

