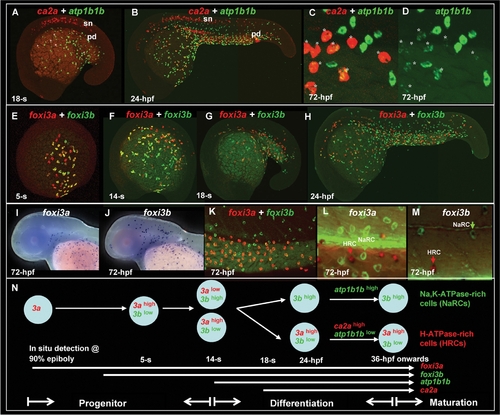
Early Development of Epidermal Ionocytes in Zebrafish Embryos. (A–D) Detection of atp1b1b (green) and ca2a (red) expression in differentiating epidermal ionocytes by fluorescent double in situ hybridization from the 18-somite (18-s) to 72-hour post fertilization (hpf) stage. Note that ca2a is also expressed on spinal cord neurons (sn) and the pronephric duct (pd) in A and B. In A, some epidermal ionocytes which were double-positive for both ca2a and atp1b1b are highlighted with asterisks. (C, D) High-magnification view of ca2a and atp1b1b expressions in the yolk extension region of 72-hpf embryos. Differentiating H+-ATPase rich-cells cells (HRCs) (labeled by asterisks) express a high level of ca2a and a low level of atp1b1b, while differentiating Na+,K+-ATPase-rich cells (NaRCs) are positive for only atp1b1b. (E–M) Dynamic expression of foxi3a (red) and foxi3b (green) in epidermal ionocyte progenitors and differentiating epidermal ionocytes from the 5-s to the 72-hpf stage. Whole-mount in situ hybridization of 72-hpf embryos show that the expression patterns between foxi3a (I) and foxi3b (J) are distinct in the cephalic domain. (K) In the yolk extension region, some cells express a high level of foxi3a (red) and a low level of foxi3b (green), while others are positive only for foxi3b (green). Immunodetection of Na+,K+-ATPase (green) and H+-ATPase (red) in 72-hpf embryos which were in situ-stained with either foxi3a (L) or foxi3b (M). Results showed that foxi3a was only expressed in HRCs (red arrow), while foxi3b was expressed by both HRCs (red arrow) and NaRCs (green arrow). (N) Schematic diagram showing the major events of epidermal ionocyte development in zebrafish embryos at the progenitor stage (the 90% epiboly to 14-s stages), differentiation stage (the 14-s stage to 36 hpf), and maturation stage (from 36 hpf onwards). The developmental stage is indicated in the left lower corner of each panel.
|
