
FIGURE
Fig. 5
- ID
- ZDB-FIG-070219-5
- Publication
- Tamme et al., 2002 - The identity and distribution of neural cells expressing the mesodermal determinant spadetail
- Other Figures
- All Figure Page
- Back to All Figure Page
Fig. 5
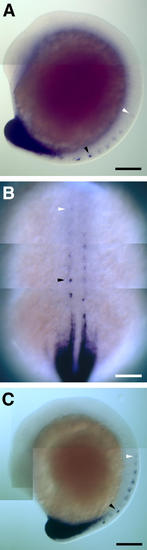
Early spt expression in the developing CNS and somites. A and C show lateral views of two embryos at 16 hpf. Rostral is up and dorsal is to the right. B shows a dorsal view of the embryo in A. Rostral is up. White arrowheads indicate the most rostral somitic domain of spt transcription visible. Black arrowheads indicate the most rostral neural cell expressing spt. For B, the light source was concentrated behind the yolk to give greater visibility of staining. All images are composites of smaller images. Scale bars equal 100 μm. |
Expression Data
| Gene: | |
|---|---|
| Fish: | |
| Anatomical Terms: | |
| Stage: | 14-19 somites |
Expression Detail
Antibody Labeling
Phenotype Data
Phenotype Detail
Acknowledgments
This image is the copyrighted work of the attributed author or publisher, and
ZFIN has permission only to display this image to its users.
Additional permissions should be obtained from the applicable author or publisher of the image.
Full text @ BMC Dev. Biol.