
Fig. 4
- ID
- ZDB-FIG-070111-8
- Publication
- Bernardos et al., 2006 - GFAP transgenic zebrafish
- Other Figures
- All Figure Page
- Back to All Figure Page
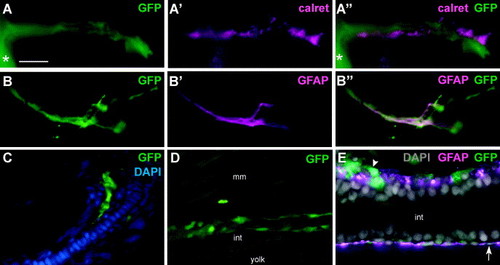
GFP expression outside the CNS. (A–E) Cryosections of Tg(gfap:GFP) transgenic zebrafish. (A) A GFP-positive process exiting the spinal cord (asterisk) at 48 hpf. (A′) An anti-calretinin-labeled peripheral motor nerve. (A″) Overlay of the GFP (green) and anti-calretinin (magenta) images reveals separate processes in close contact with each other. (B) A GFP-positive process exiting the spinal cord in a zebrafish larva at 5 dpf. (B′) This process was also labeled by anti-GFAP and (B″) an overlay of the two images demonstrates co-localization of the anti-GFAP (magenta) and GFP (green) signals. (C) GFP expression in the pectoral fin bud at 72 hpf. The overlay of GFP (green) and DAPI (blue) images shows the GFP-positive processes entering the proximal aspect of the fin bud. (D) At 72 hpf GFP expression was observed in cells located just dorsal to the developing intestinal tract (mm = muscle; int = intestinal tract). (E) An overlay of GFP (green), anti-GFAP (magenta) and DAPI (grey) images shows the location of the GFP-positive cells (arrowhead) and processes (arrow) in relation to the intestinal tract and GFAP expression at 96 hpf. Scale bar: 8 μm (A); 15 μm (B); or 20 μm (C–E). |
| Genes: | |
|---|---|
| Fish: | |
| Anatomical Terms: | |
| Stage Range: | Long-pec to Day 5 |
Reprinted from Gene expression patterns : GEP, 6(8), Bernardos, R.L., and Raymond, P.A., GFAP transgenic zebrafish, 1007-1013, Copyright (2006) with permission from Elsevier. Full text @ Gene Expr. Patterns