
- Title
-
GFAP transgenic zebrafish
- Authors
- Bernardos, R.L., and Raymond, P.A.
- Source
- Full text @ Gene Expr. Patterns

A diagram of the gfap:GFP expression vector showing the orientation of the gfap regulatory elements (7.4 kb) within the EGFP-1 plasmid (4.1 kb). |
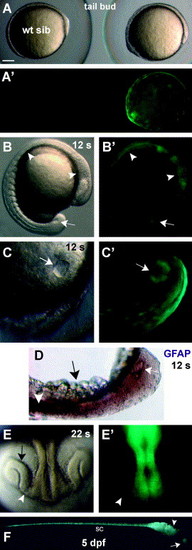
Transgene expression during early development of live Tg(gfap:GFP) embryos. In this and all subsequent figures, dorsal is up and anterior to the right, unless otherwise noted. (A, A′) Two F1 siblings from the same clutch at the tail bud-stage (∼10 hpf). The wild-type sibling (left; wt sib; anterior to the left) did not express GFP. The transgenic sibling (right) was GFP-positive. (B, B′) A lateral view of an embryo at the 12-somite-stage (12 s; ∼15 hpf) shows GFP in the brain, spinal cord (arrowheads) and also in Kupffer’s vesicle (arrow) in the leading edge of the tail bud. (C, C′) Kupffer’s vesicle at higher magnification (arrow) at the 12-somite-stage. (D) Whole-mount in situ hybridization of a fixed 12-somite-stage embryo demonstrates labeling of Kupffer’s vesicle (arrow) and the developing spinal cord (arrowhead) by an antisense gfap RNA probe (dark purple). The yolk was removed for imaging purposes (black arrow). (E, E′) A 22-somite-stage (22 s;∼20 hpf) embryo strongly expresses GFP in the brain and moderately along the optic stalk (arrowhead) towards the retinal primordium (arrow), which did not express GFP. (F) In a larval fish at 5 dpf the lens (arrow), brain (arrowhead) and spinal cord (sc) strongly express GFP. Scale bar: 150 μm (A); 100 μm (B); 25 μm (C); 45 μm (D); 50 μm (E); or 300 μm (F). EXPRESSION / LABELING:
|
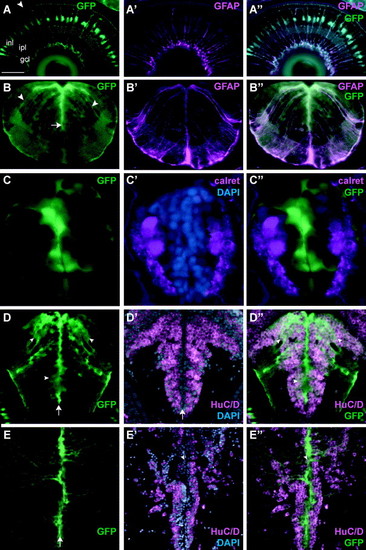
GFP expression in the CNS of Tg(gfap:GFP) embryos with comparisons to glial and neuronal markers in cryosections. (A) In the retina at 96 hpf, GFP expression (green) is exclusively in Müller glia. Their cell bodies are located in the inner nuclear layer (inl) and radial processes extend from the inner limiting membrane, the boundary of the ganglion cell layer (gcl), to the outer limiting membrane, the boundary of the outer nuclear layer (arrowhead). Fine lateral processes of the Müller cells fill the inner plexiform layer (ipl). (A′) Anti-GFAP (magenta) labels intermediate filaments that are predominately located in the inner radial processes and endfeet of the Müller glia at the inner limiting membrane. (A″) All Müller processes labeled with anti-GFAP also show GFP expression. (B) In a transverse section through the hindbrain of a 96 hpf embryo. GFP-positive radial glia cell bodies (arrow) are near the ventricular surface and radial processes extend outwards to the pial surface (arrowheads). (B′, B″) The GFP-positive glial processes are also labeled by anti-GFAP. (C) A transverse section through the spinal cord of a 72 hpf zebrafish. GFP-positive cells surround the central canal and some have processes extending to the pial surface. (C′) Anti-calretinin (magenta) labels spinal neurons lateral to the central canal, but does not label any GFP-positive cells (C″). (D) Transverse section through the midbrain of a 72 hpf zebrafish reveals GFP-positive cell bodies adjacent to the ventricle (arrow) and less intensely labeled cells further from the ventricle (arrowheads). (D′) Overlay of HuC/D (magenta) and DAPI (blue) images reveals that the majority of cells are HuC/D-positive with the exception of cells adjacent to the ventricle (arrow). (D″) Overlay of the GFP and HuC/D images shows many of the HuC/D positive cells near the ventricle are also GFP-positive. (E) Transverse section through the midbrain of a 1-month-old zebrafish. GFP-positive cells are located along the ventricle (arrow) and extend processes toward the pial surface. (E′) Overlay of HuC/D and DAPI images. (E″). HuC/D-positive neurons are no longer GFP-positive, except for an occasional cell close to the ventricle (arrowhead). Scale bar: 40 μm (A, D, and E); 30 μm (B); or 15 μm (C). EXPRESSION / LABELING:
|
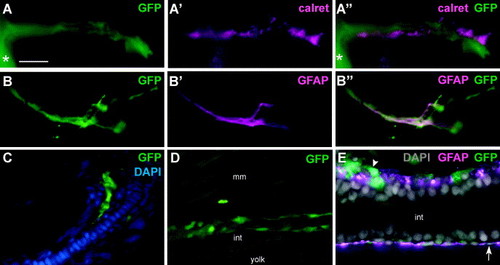
GFP expression outside the CNS. (A–E) Cryosections of Tg(gfap:GFP) transgenic zebrafish. (A) A GFP-positive process exiting the spinal cord (asterisk) at 48 hpf. (A′) An anti-calretinin-labeled peripheral motor nerve. (A″) Overlay of the GFP (green) and anti-calretinin (magenta) images reveals separate processes in close contact with each other. (B) A GFP-positive process exiting the spinal cord in a zebrafish larva at 5 dpf. (B′) This process was also labeled by anti-GFAP and (B″) an overlay of the two images demonstrates co-localization of the anti-GFAP (magenta) and GFP (green) signals. (C) GFP expression in the pectoral fin bud at 72 hpf. The overlay of GFP (green) and DAPI (blue) images shows the GFP-positive processes entering the proximal aspect of the fin bud. (D) At 72 hpf GFP expression was observed in cells located just dorsal to the developing intestinal tract (mm = muscle; int = intestinal tract). (E) An overlay of GFP (green), anti-GFAP (magenta) and DAPI (grey) images shows the location of the GFP-positive cells (arrowhead) and processes (arrow) in relation to the intestinal tract and GFAP expression at 96 hpf. Scale bar: 8 μm (A); 15 μm (B); or 20 μm (C–E). |
Reprinted from Gene expression patterns : GEP, 6(8), Bernardos, R.L., and Raymond, P.A., GFAP transgenic zebrafish, 1007-1013, Copyright (2006) with permission from Elsevier. Full text @ Gene Expr. Patterns