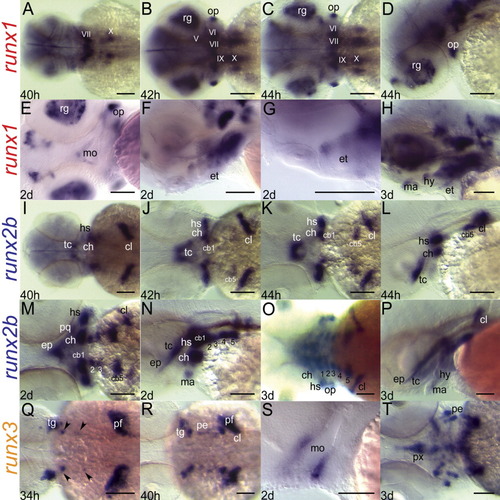
Expression patterns of the runx genes at the onset of and during craniofacial cartilage development (34hpf to 3dpf). (A-H) runx1; (I-P) runx2b; (Q-T) runx3; (A-C, I-K, M,O,Q,R,T) dorsal view; (D,F,H,L,N,P) lateral view left; (E) ventral view; (G,S) magnified lateral view, oral region. All embryos anterior to left. Roman numerals V-X denote expression of runx1 in the cranial nerve ganglia. Presumptive retinal ganglion cells (rg) of the eye and the opercula are also labelled with runx1 riboprobe. Transcripts for runx2b are prevalent in the pre-cartilage mesenchyme, cleithra, and opercula, while those for runx3 mark the trigeminal ganglia, the pharyngeal endoderm, and the pectoral fin anlagen. Early runx3 expression in the pouch endoderm (black arrowheads) is positioned just posterior to the trigeminal ganglia. cb, ceratobranchial (numbers denote cb identity); ch, ceratohyal; cl, cleithrum; ep, ethmoid plate; et, epithelium; hy, hyoid; hs, hyosymplectic; ma, mandibular; mo, mouth; op, operculum; ov, otic vesicle; pc, parachordal; pe, pouch endoderm; pf, pectoral fin; pq, palatoquadrate; px, pharynx; tc, trabecula cranii. Scale bars = 100 μm.
|
